Monitor and troubleshoot
This version of the Anyscale docs is deprecated. Go to the latest version for up to date information.
Jobs provide access to a couple of tools for troubleshooting.
- Events
- Logs
- Alert
- Ray Dashboard
- Grafana metrics
Events
Events capture the critical state transitions of your Jobs. View them on the Console UI.
Logs
For both running and terminated Jobs, you can view logs of a Jobs on the Console.
For a running Job
For running Jobs, you can follow it using the CLI or the Python SDK.
- CLI
- Python SDK
anyscale job logs --job-id <JOB_ID> --follow
from anyscale import AnyscaleSDK

sdk = AnyscaleSDK()

job_logs = sdk.get_production_job_logs(JOB_ID)
For a terminated or completed Job
Known Limitations
- Downloading logs only works for clouds on AWS. Support for downloading logs on GCP is coming soon.
- Only application and Ray system logs are persisted and able to be downloaded. Downloading logs from
ray_resultsis not supported yet.
For a terminated or completed Job, you can download the log files from the Cluster that ran the Job.
Setup
There is no additional setup required. Logs will be uploaded and stored from clusters to the cloud object storage bucket associated to the Anyscale Cloud by default.
View and Download Logs
Use anyscale logs to view and download logs. View the "Ray Logs" tab on the console UI for more instructions.
# View logs for a particular cluster. Cluster ID can be found by going to the Job page and finding the cluster the Job was run on. It should look something like ses_8kVvPt6pNkR7xJlEE2zfQQXW
anyscale logs cluster --id <cluster-id> <glob-filter | filename>

# Download all logs for a particular cluster
anyscale logs cluster --id <cluster-id> --download

# More help
anyscale logs cluster --help
Alert
Anyscale sends you email notifications when the following events happen on a Job created by you:
- Job completes successfully
- Job fails after exceeding configured retries
- Job fails due to system failures
These emails are sent from Anyscale Alerts (do not reply) <alerts@console.anyscale.com>, so please ensure that this is not blocked or marked as spam.
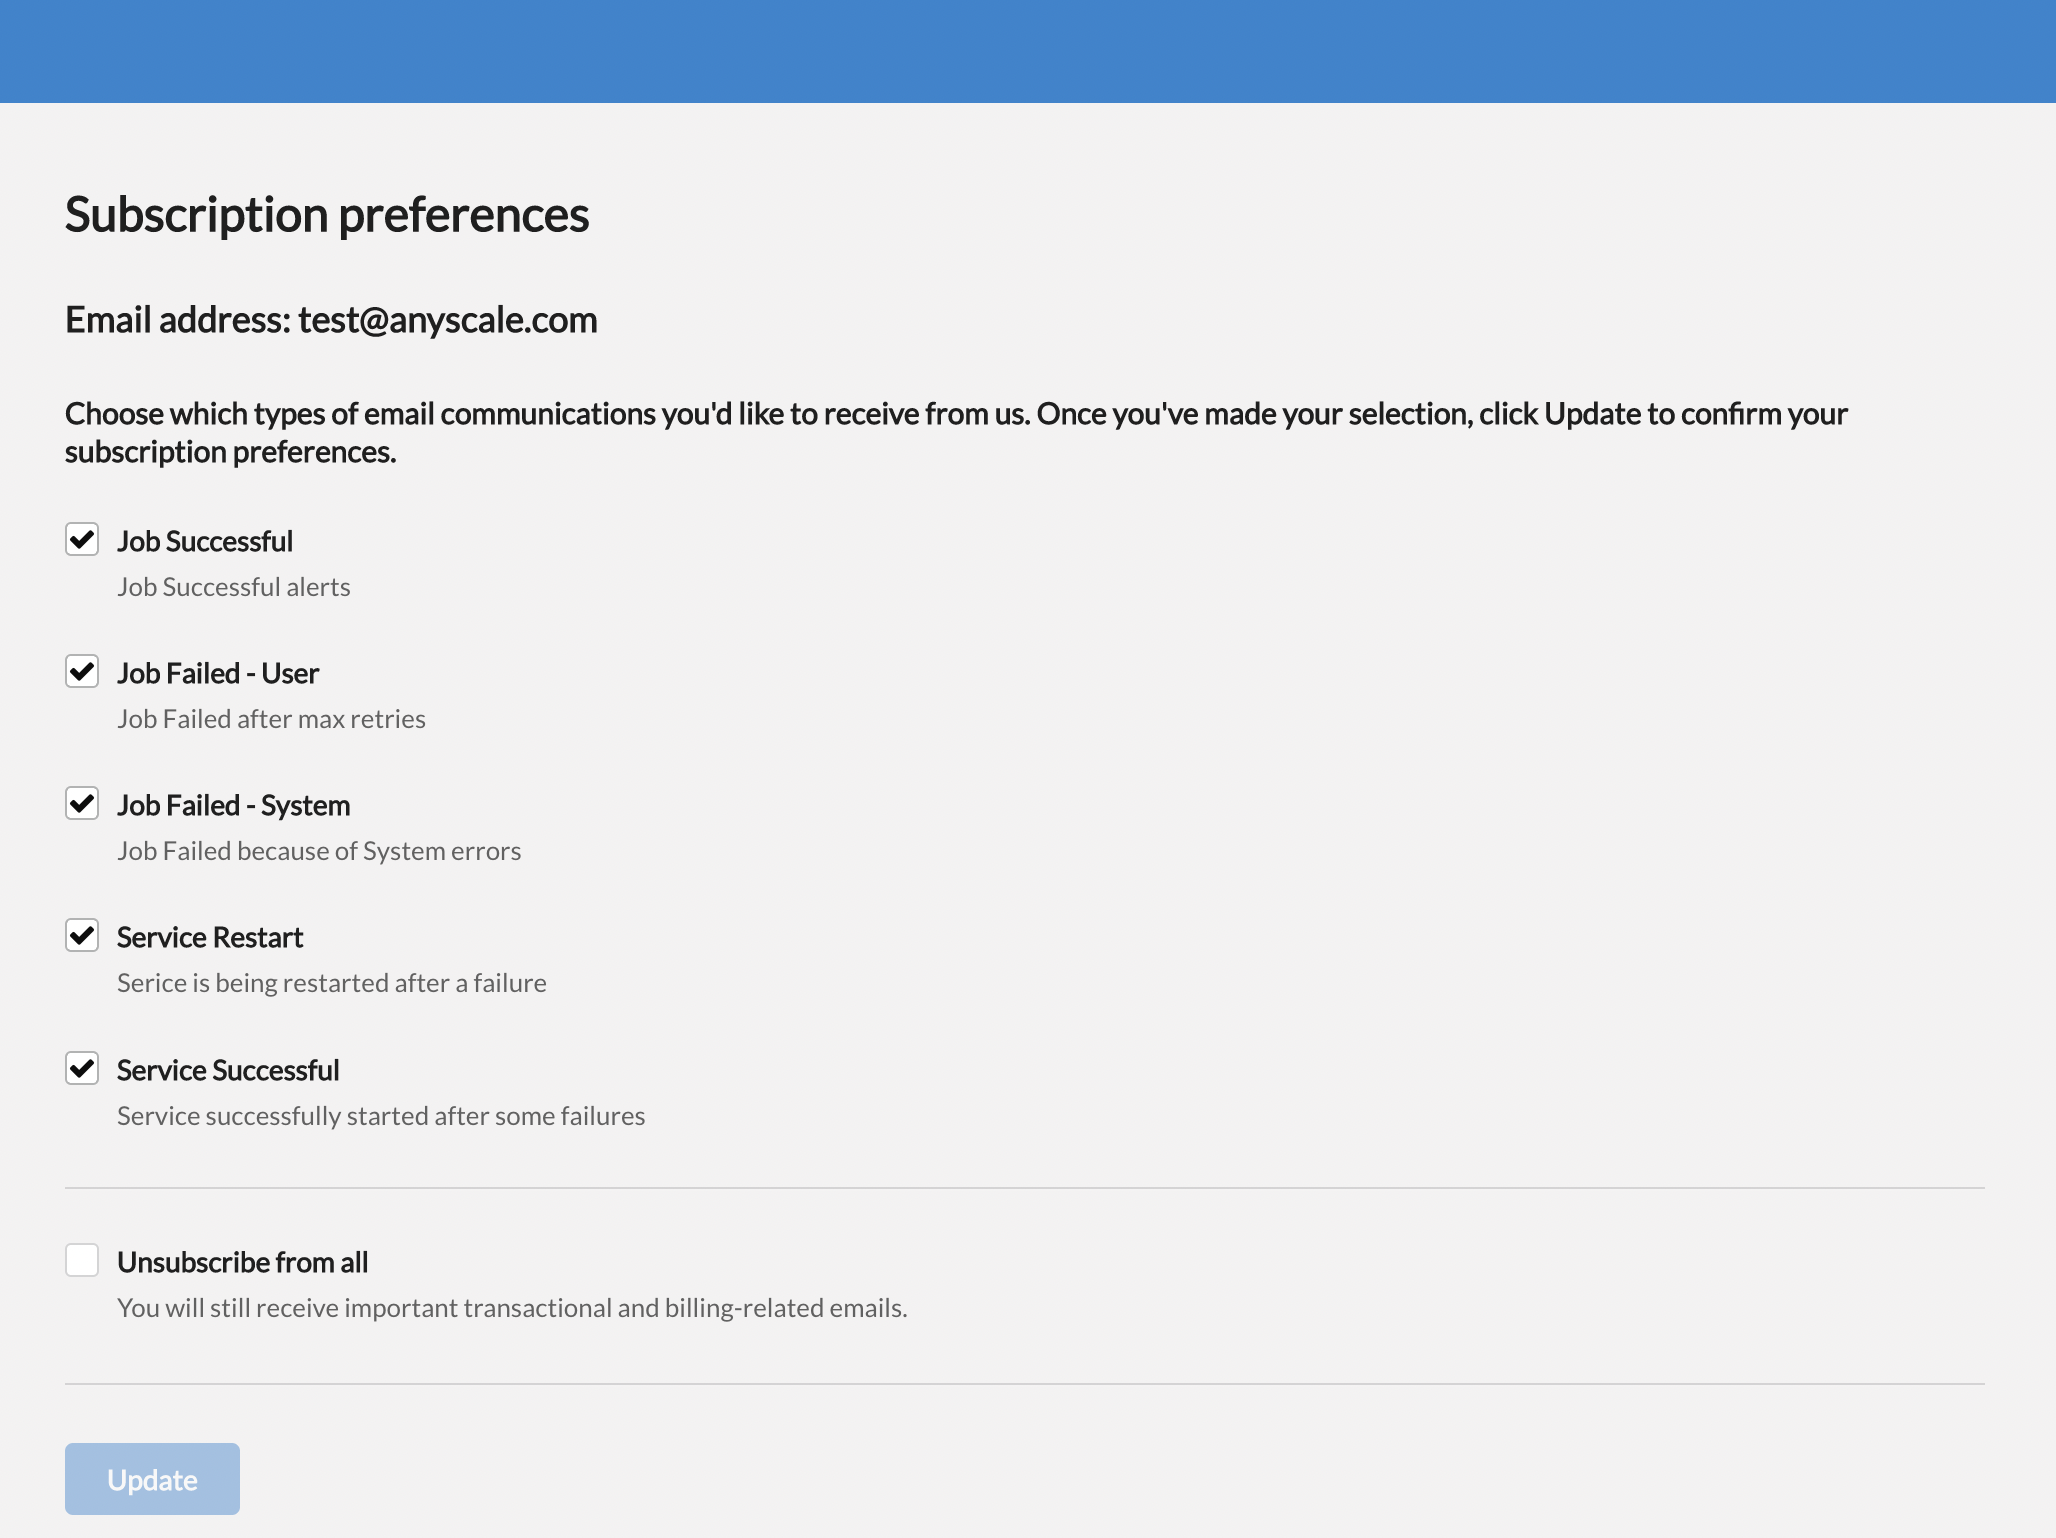
By default you are automatically subscribed for all notification emails. You can manage subscription by clicking the Unsubscribe link in the footer of the email. Clicking the Unsubscribe link will take you to a subscription preferences page (see below screenshot), where you can selectively subscribe/unsubscribe from these notifications emails (topics). Make sure to click the Update button at the bottom of this page after checking/unchecking your subscription preferences. You will stop receiving emails for topics that are unchecked after the update. To subscribe again, simply check and update the topic in subscription preferences page.

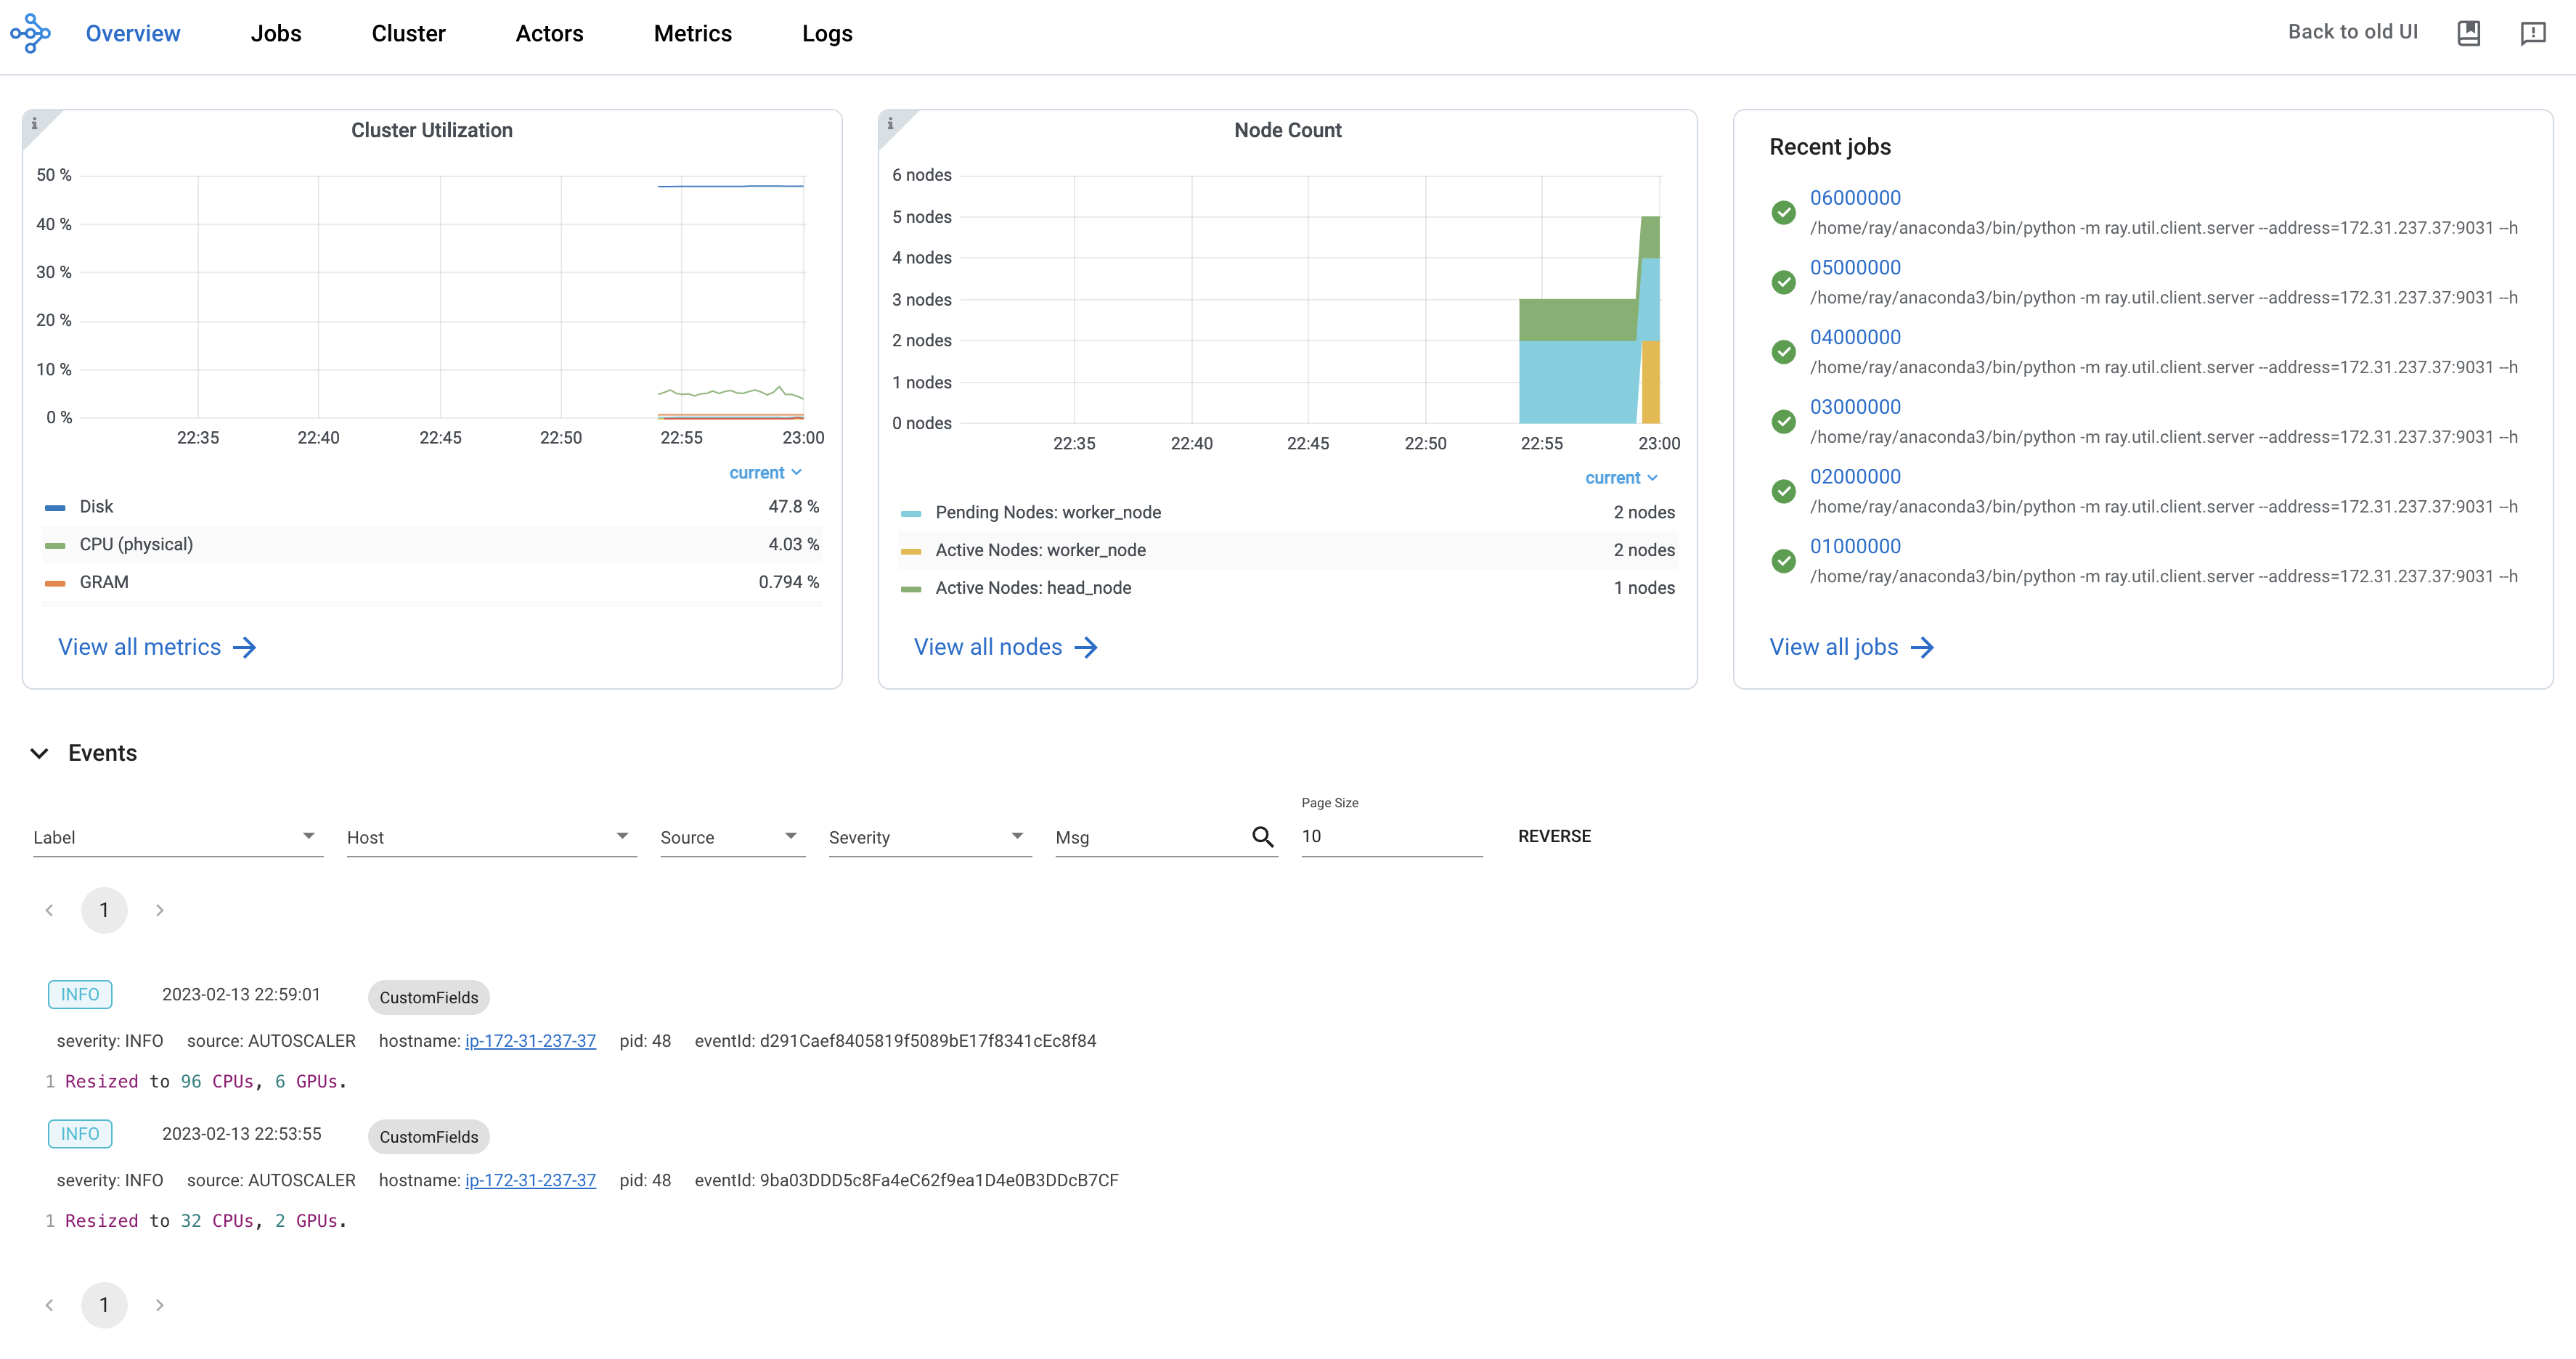
Ray Dashboard
When the Job is running, click the "Dashboard" button to view the Ray Dashboard for the underlying cluster. Click here to learn about how to use Ray Dashboard.

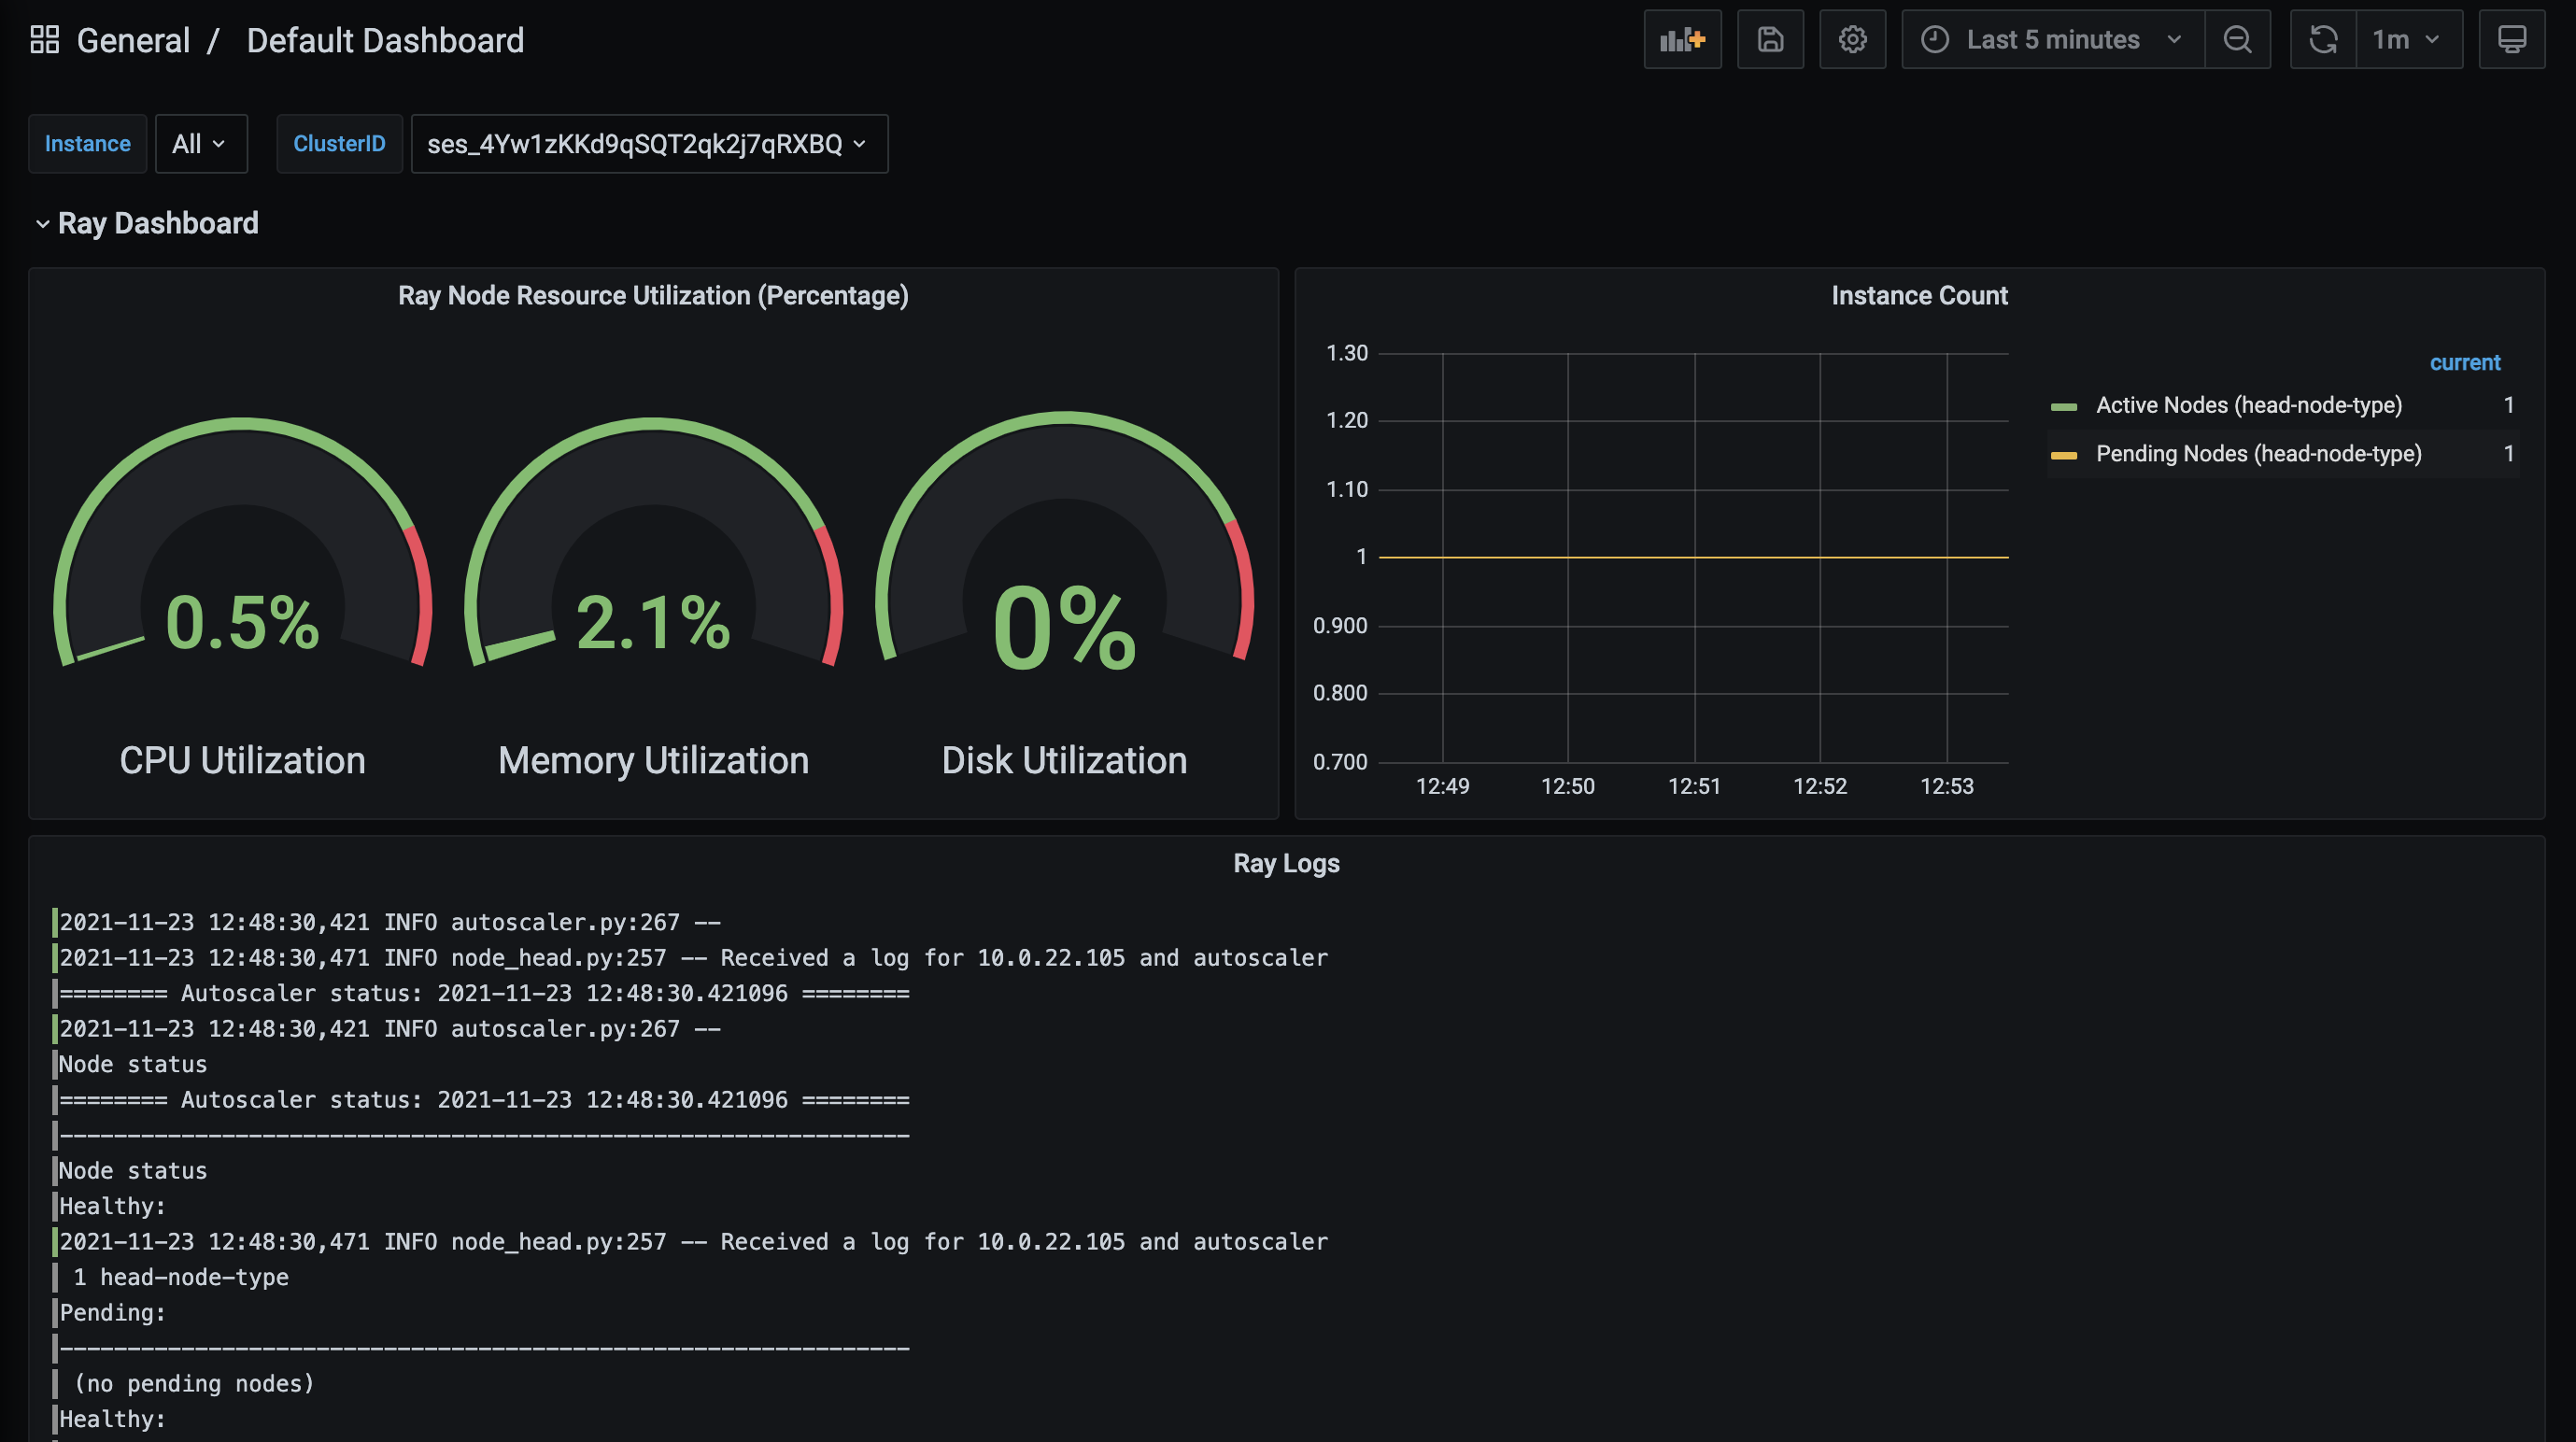
Grafana
Click on the Metrics button from "Dashboard" to display the performance metrics of the underlying Ray cluster.

Grafana dashboard data is retained for 90 days from cluster termination.