Observability and alerting
This version of the Anyscale docs is deprecated. Go to the latest version for up to date information.
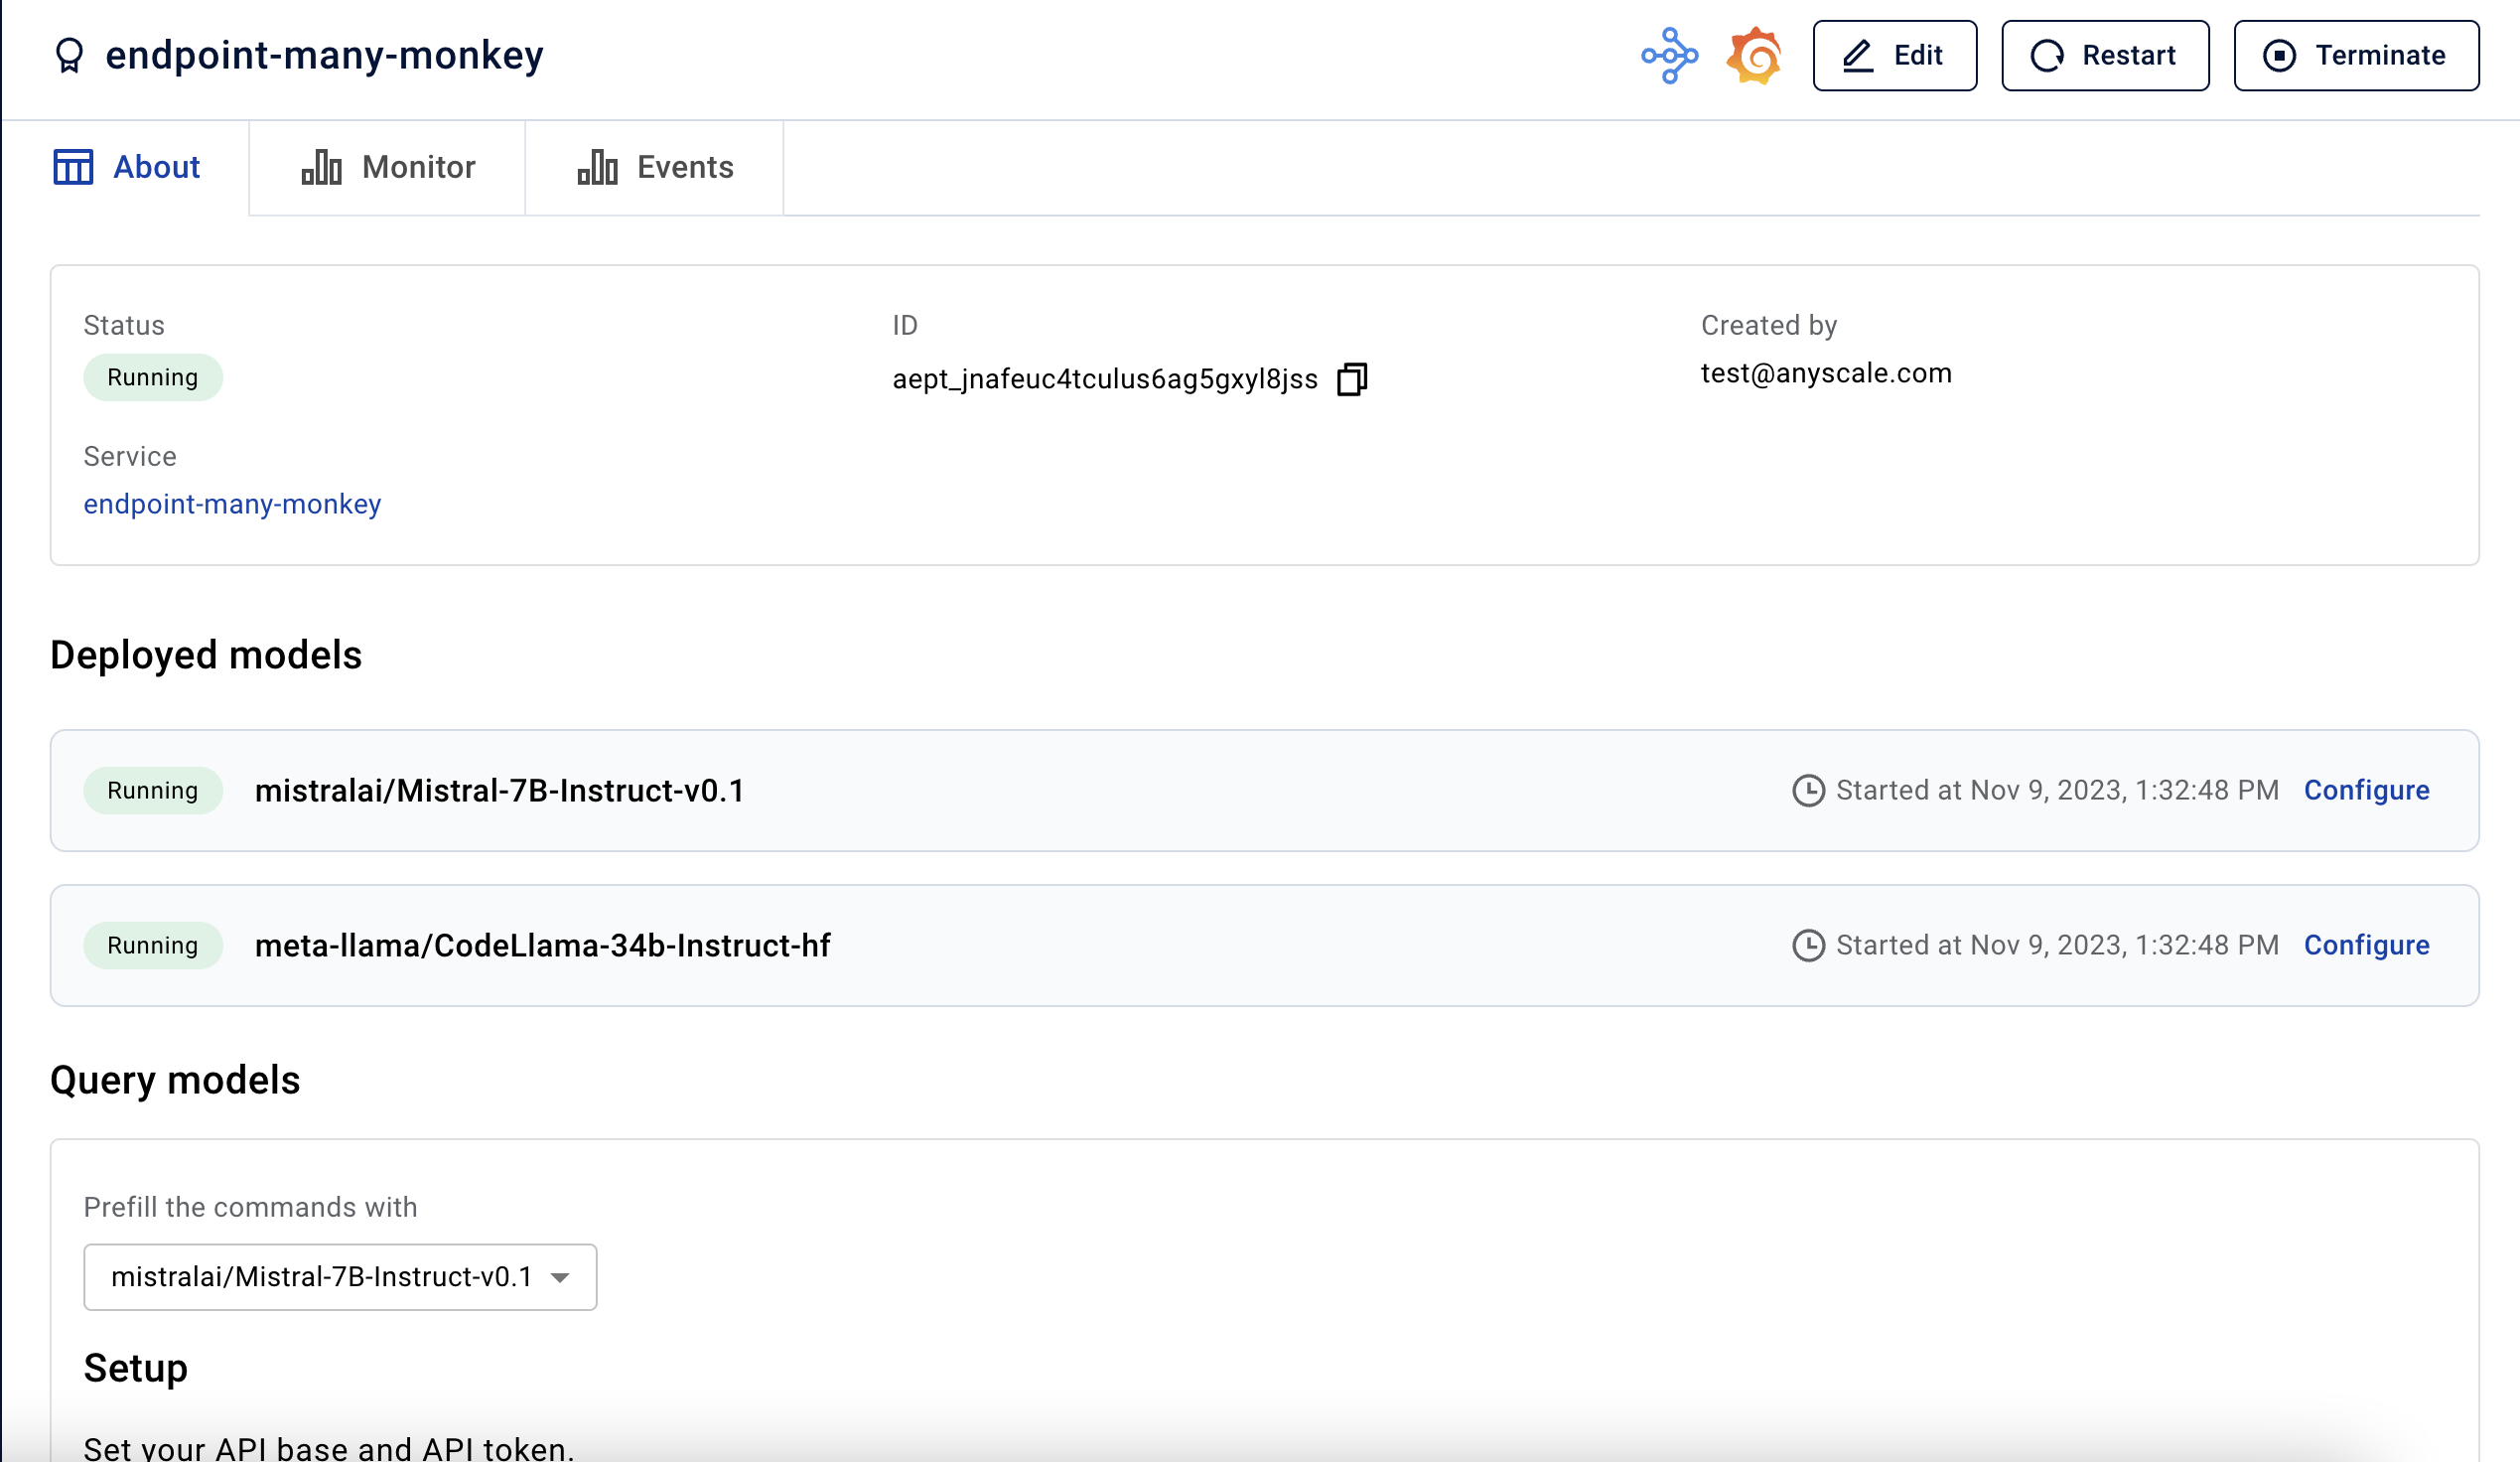
Endpoints Server overview page
The Endpoints Server overview page provides high-level details and configuration options for your deployed models. The Monitor tab offers status information on events and common metrics at a glance. For more advanced observability tooling, see the following section.

Endpoints Server Grafana dashboard
Grafana powers the Endpoints Server monitoring page and lets you visualize metrics, logs, and traces. Access this dashboard by clicking on the Grafana icon at the top-right side of the Endpoints Server overview page.

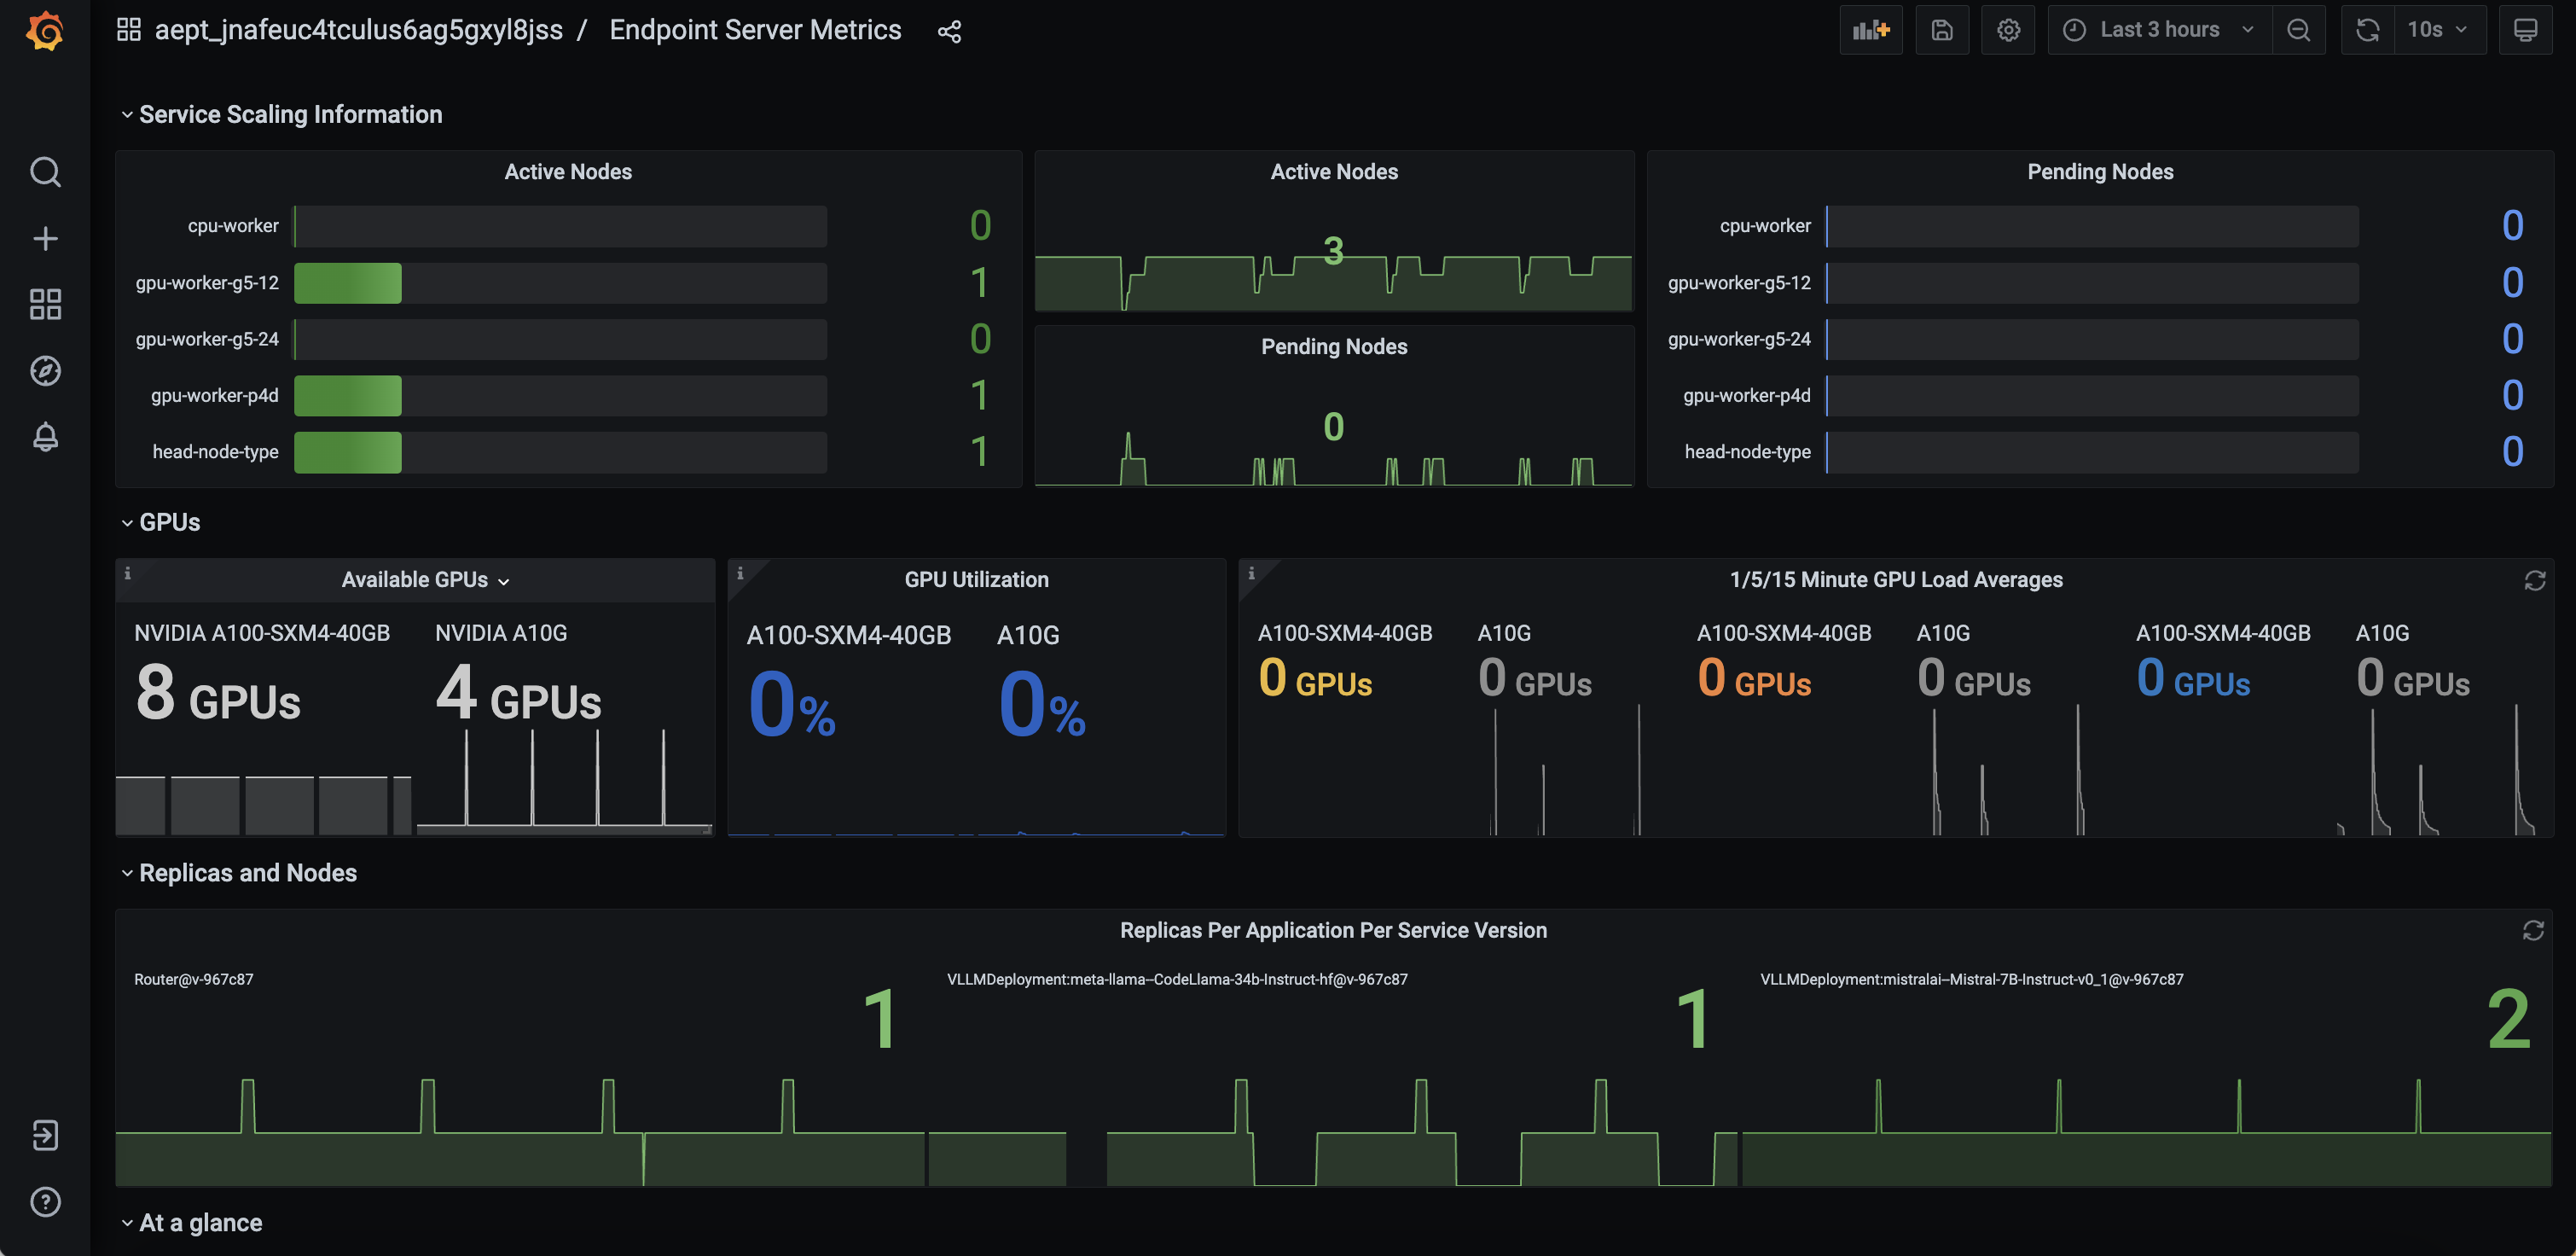
For a better understanding of the Grafana dashboard, here's a curated list of essential metrics to understand the overall health of your deployed models:
Scaling Information
Active Nodes: Current nodes in the cluster.Pending Nodes: Nodes in provisioning.
GPUs
Available GPUs: Total GPUs available for provisioning.GPU Utilization: Utilization per GPU.1/5/15 Minute GPU Load Averages: Average utilization per GPU over specified intervals.
Replicas and Nodes
Replicas Per Application: Replicas running per application.
At a glance
Tokens Last Hour: Total input and generated tokens over the last hour.Tokens Last 24 Hours: Total input and generated tokens over the last day.Tokens Per Model Last 24 Hours: Tokens generated per model over the last day.Distribution of Requests Per Model Last 24 Hours: Total requests and responses over the last hour.Requests Last Hour: Pie diagram of request distribution across all models over the last day.Ratio Input (Generated Tokens Last 24 Hours): Rate of token usage per model.
Endpoints
RPS: Requests per second directed to each API server.Successful: Successful requests.Failures: Failed requests.
Tokens and Requests Graph
Tokens Input Per Minute: Rate of input tokens per minute.Tokens Input Per Request: Rate of input tokens per request.Tokens Started Per Minute Per Model: Rate of requests per minute.Tokens Generated Per Minute: Rate of generated tokens per minute.Tokens Generated Per Request: Rate of generated tokens per request.Request Errors Per Minute Per Model: Rate of error requests per minute per model.
Latencies
First Token Stream Latency: First token latency by percentiles.Response Stream Latency: Response stream latency by percentiles.
Alerts
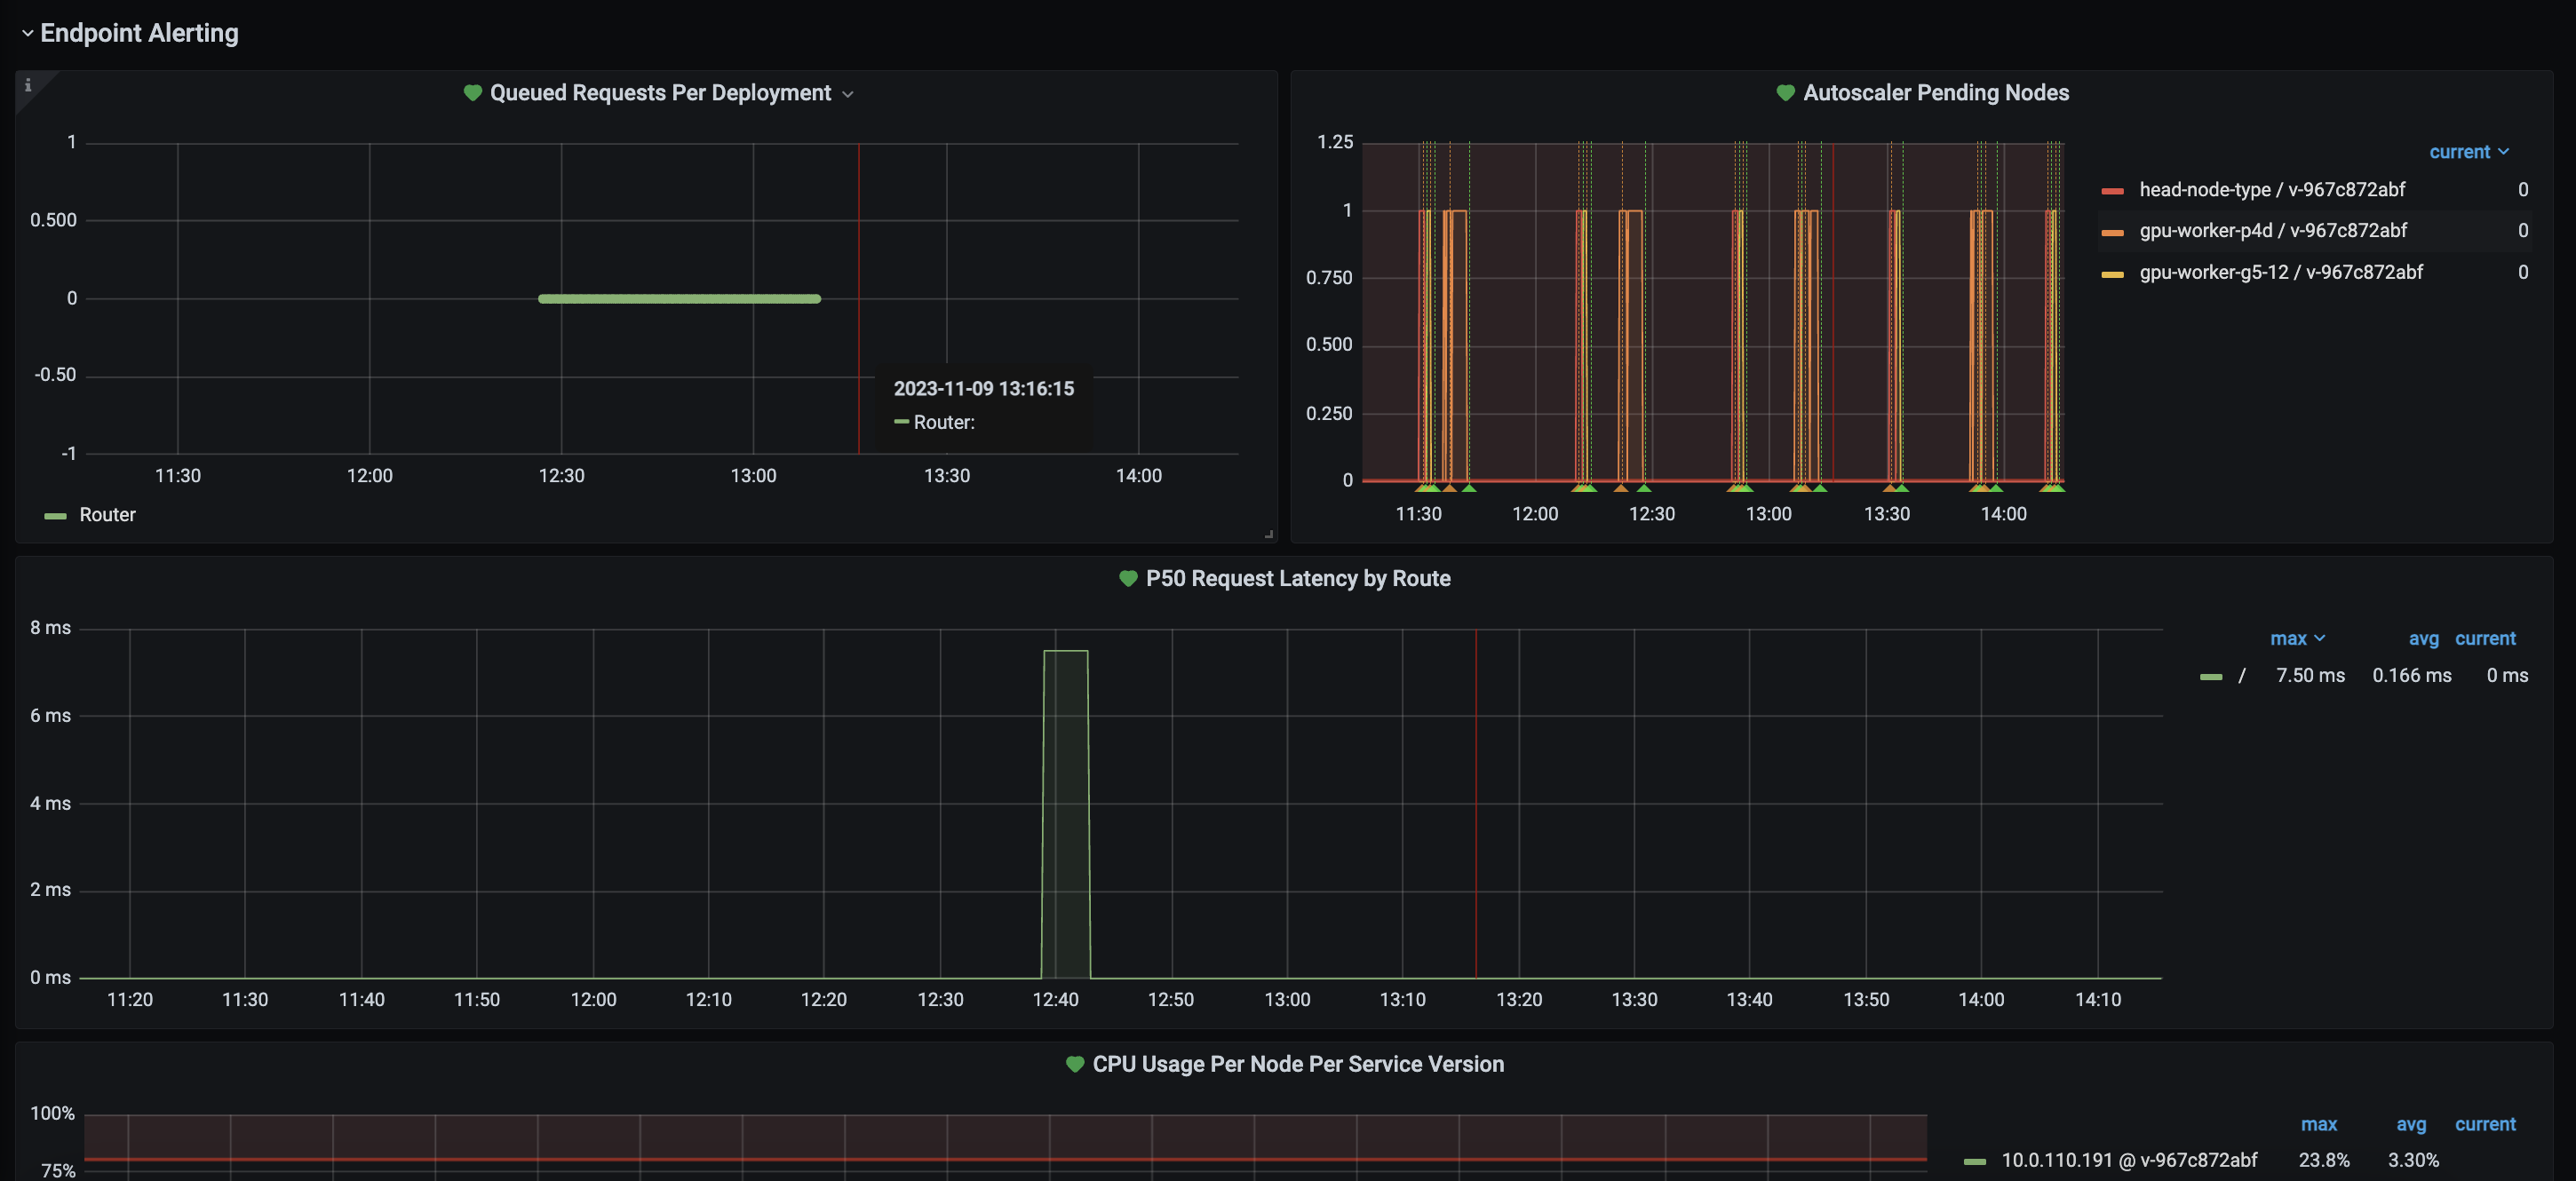
Anyscale preconfigures alerts through Grafana to send notifications when incidents occur with your Endpoints Server. View alerts on the alerting page. Find the corresponding metrics in the Endpoints Server metrics dashboard under the Endpoint Alerting header.

Preconfigured alerts
Anyscale automatically configures the following alerts:
| Alert | Description |
|---|---|
Autoscaler Pending Nodes | Alert when a node remains in the pending state for more than 15 minutes. |
CPU Usage | Alert when CPU usage on any node exceeds 80% for more than 5 minutes. |
P50 Request Latency | Alert when the median latency for requests exceeds 60 seconds for more than 5 minutes by route. |
Queued Requests | Alert when queued requests exceed 50 per minute within a 5-minute window. |
Serve 4XX Responses | Alert when the number of 4XX HTTP responses, or "client errors," reaches 5 within a 5-minute window. |
Serve 5XX Responses | Alert when the number of 5XX HTTP responses, or "server errors," reaches 2 within a 5-minute window. |
Set up alerting channels
To receive alerts, you need to configure a notification channel and select the specific alerts you would like to receive a notification for.
Anyscale doesn't support for email notifications through Grafana. If this is a feature you would like, contact the support team at endpoints-help@anyscale.com.
To create the notifications, follow the steps below:
- PagerDuty
- Slack
- Obtain your organization's PagerDuty integration key.
- Click on Manage Alerts on the Endpoints Server overview page.
- Select the Notification Channels tab and configure a PagerDuty notification channel using the integration key.
- Navigate back to Alert Rules and enable the desired alerts by clicking Edit Alert and adding the notification channel.
- Obtain your organization's Incoming Webhook URL.
- Click on Manage Alerts on the Endpoints Server overview page.
- Select the Notification Channels tab and configure a PagerDuty notification channel using the integration key.
- Navigate back to Alert Rules and enable the desired alerts by clicking Edit Alert and adding the notification channel.
Manually configure panels and alerts
You can customize panels and alerts in the Endpoints Server Grafana dashboard to suit your use cases. For panels, access the Grafana Dashboard and select the edit button. For alerts, navigate to the Alert Rules page and update the query and alert rules. These settings persist for the duration of the Endpoint Server's life.