Tracing guide
These docs are for the new Anyscale design. If you started using Anyscale before April 2024, use Version 1.0.0 of the docs. If you're transitioning to Anyscale Preview, see the guide for how to migrate.
This feature is experimental, reach out with feedback or any issues encountered.
This guide provides three tutorials on how to add OpenTelemetry tracing for a Ray Serve applications in an Anyscale Service. The first tutorial provides a quick start on how to collect Ray Serve traces and view them in the Ray logs. The second tutorial provides a more in-depth example on how to instrument your application. The third details how to export traces to a tracing backend.
Note that by default, each request handled by the Serve application exports a trace that provides observability of the full span of the request.
The code used for this tutorial can be found in this public GitHub repo.
Getting started
Quick start
Set the tracing_config in the service config.
name: default-tracing-service
working_dir: https://github.com/anyscale/tracing-example
applications:
- name: my_app
    route_prefix:  '/'
    import_path: default_serve_hello:app
    runtime_env: { }
tracing_config:
  enabled: True
  sampling_ratio: 1.0
Deploy the service using the following command.
anyscale service deploy -f service.yaml
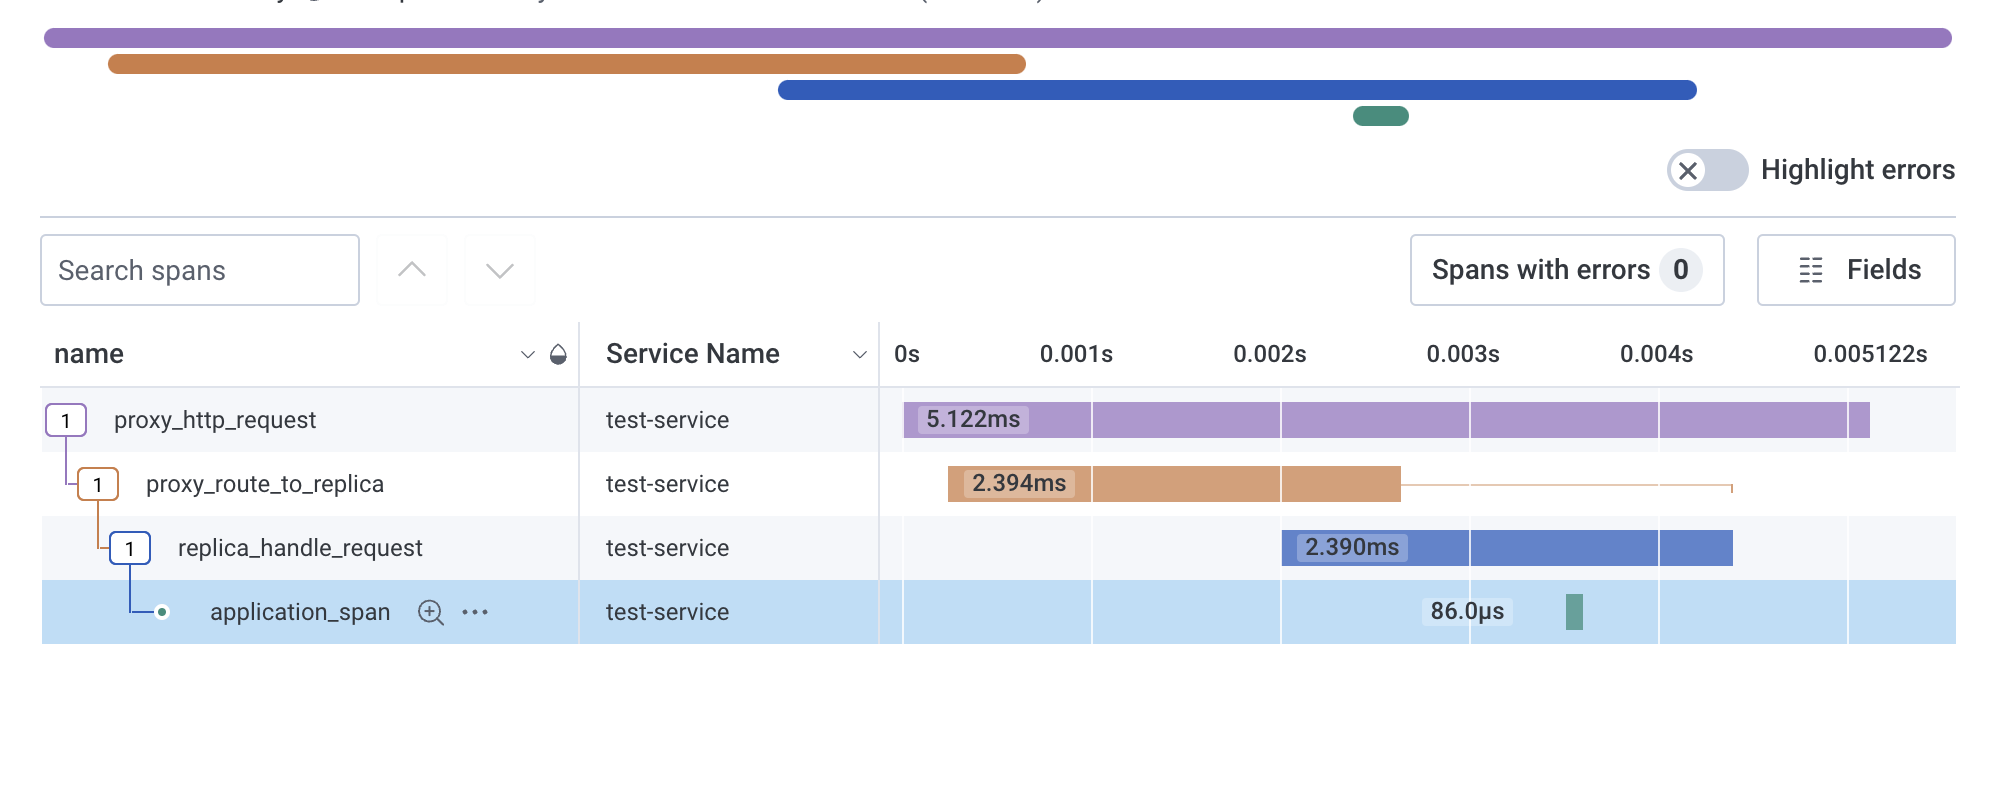
After querying your application, traces will be exported to the logs/serve/spans/ folder on instances with active replicas.
{
    "name": "proxy_http_request",
    "context": {
        "trace_id": "0x88aef1ad547167b44a15479f57a6383e",
        "span_id": "0x59989b70393625e3",
        "trace_state": "[]"
    },
    "kind": "SpanKind.SERVER",
    "parent_id": null,
    "start_time": "2024-05-28T18:05:04.864137Z",
    "end_time": "2024-05-28T18:05:04.891003Z",
    "status": {
        "status_code": "OK"
    },
    "attributes": {
        "request_id": "cf86e040-2c53-44b8-976e-55224b692141",
        "deployment": "HelloWorld",
        "app": "default",
        "request_type": "http",
        "request_method": "GET",
        "request_route_path": "/"
    },
    "events": [],
    "links": [],
    "resource": {
        "attributes": {
            "telemetry.sdk.language": "python",
            "telemetry.sdk.name": "opentelemetry",
            "telemetry.sdk.version": "1.24.0",
            "service.name": "unknown_service"
        },
        "schema_url": ""
    }
}
Instrumenting a Serve application
This tutorial provides guidance on how to instrument a Serve application with custom tracing and third party OpenTelemetry compatible instrumentors.
The first step is augmenting the Serve application with OpenTelemetry traces and the FastAPIInstrumentor.
We import FastAPIInstrumentor from here to bypass an incompatibility issue with Ray Serve.
from fastapi import FastAPI
from ray import serve
from fp import FastAPIInstrumentor
from opentelemetry import trace
from opentelemetry.trace.status import Status, StatusCode
from ray.anyscale.serve._private.tracing_utils import (
    get_trace_context,
)

app = FastAPI()
FastAPIInstrumentor().instrument_app(app)
@serve.deployment
@serve.ingress(app)
class HelloWorld:
    @app.get("/")
    def hello(self):
        # Create a new span that is associated with the current trace
        tracer = trace.get_tracer(__name__)
        with tracer.start_as_current_span(
            "application_span", context=get_trace_context()
        ) as span:
            replica_context = serve.get_replica_context()
            # Update the span attributes and status
            attributes = {
                "deployment": replica_context.deployment,
                "replica_id": replica_context.replica_id.unique_id
            }
            span.set_attributes(attributes)
            span.set_status(
                Status(status_code=StatusCode.OK)
            )

            # Return message
            return "Hello world!"

app = HelloWorld.bind()
Next, define the service configuration with a service YAML.
name: tracing-service
working_dir: https://github.com/anyscale/tracing-example
applications:
- name: my_app
    route_prefix:  '/'
    import_path: serve_hello:app
    runtime_env: { }
tracing_config:
  enabled: True
  sampling_ratio: 1.0
To deploy the service, we can run the following command.
anyscale service deploy -f service.yaml
After querying your application, traces will be exported to the logs/serve/spans/ folder on instances with active replicas.
{
    "name": "application_span",
    "context": {
        "trace_id": "0xff1e005576c03988af36a72bb53af9b0",
        "span_id": "0xadf6ad79766eb568",
        "trace_state": "[]"
    },
    "kind": "SpanKind.INTERNAL",
    "parent_id": "0xdf94f8c2dbf8f6ff",
    "start_time": "2024-06-04T20:52:12.558024Z",
    "end_time": "2024-06-04T20:52:12.558047Z",
    "status": {
        "status_code": "OK"
    },
    "attributes": {
        "deployment": "HelloWorld",
        "replica_id": "7u8nq1c3"
    },
    "events": [],
    "links": [],
    "resource": {
        "attributes": {
            "telemetry.sdk.language": "python",
            "telemetry.sdk.name": "opentelemetry",
            "telemetry.sdk.version": "1.24.0",
            "service.name": "unknown_service"
        },
        "schema_url": ""
    }
}
{
    "name": "GET / http send",
    "context": {
        "trace_id": "0xd02e60adebf4010d29f7057b373224f9",
        "span_id": "0x13dec7bea39c7d48",
        "trace_state": "[]"
    },
    "kind": "SpanKind.INTERNAL",
    "parent_id": "0x288b70e107316859",
    "start_time": "2024-06-04T20:52:12.558452Z",
    "end_time": "2024-06-04T20:52:12.558489Z",
    "status": {
        "status_code": "UNSET"
    },
    "attributes": {
        "http.status_code": 200,
        "type": "http.response.start"
    },
    "events": [],
    "links": [],
    "resource": {
        "attributes": {
            "telemetry.sdk.language": "python",
            "telemetry.sdk.name": "opentelemetry",
            "telemetry.sdk.version": "1.24.0",
            "service.name": "unknown_service"
        },
        "schema_url": ""
    }
}
Defining a custom exporter
This tutorial provides guidance on how to export the OpenTelemetry traces to a tracing backend. This will require defining an OpenTelemetry compatible exporter inside a Docker image and referencing that exporter inside the service YAML.
Build an image containing an OpenTelemetry compatible exporter
To export traces to a tracing backend, we need to define a tracing exporter function in exporter.py. The tracing exporter needs to be a Python function that takes no arguments and returns a list of type SpanProcessor. Note, you can configure this function to return several span processors so traces are exported to multiple backends.
import os

from opentelemetry.sdk.trace.export import SpanProcessor, BatchSpanProcessor
from opentelemetry.ext.honeycomb import HoneycombSpanExporter

from typing import List

def default_tracing_exporter() -> List[SpanProcessor]:
    exporter = HoneycombSpanExporter(
        service_name="",
        writekey="",
        dataset="",
    )

    return [BatchSpanProcessor(exporter)]
Then define a Dockerfile and environment dependencies.
# requirements.txt
opentelemetry-sdk==1.25.0
opentelemetry-api==1.25.0
opentelemetry-instrumentation==0.46b0
opentelemetry.instrumentation.fastapi==0.45b0
opentelemetry-ext-honeycomb==1.3.0
asgiref
deprecated
importlib-metadata
zipp
opentelemetry.instrumentation.asgi==0.46b0
opentelemetry-util-http==0.46b0
opentelemetry-semantic-conventions==0.46b0
libhoney
statsd
# Use Anyscale base image
FROM anyscale/ray:2.24.0-slim-py310

# Copy the requirements file into the Docker image
COPY requirements.txt .

# Install all dependencies specified in requirements.txt
RUN pip install --no-cache-dir  --no-dependencies -r requirements.txt

# Copy exporter file and application definitions into the Docker image
COPY exporter.py /home/ray/exporter.py
COPY serve_hello.py /home/ray/serve_hello.py
COPY fp.py /home/ray/fp.py

# Add working directory into python path so they are importable
ENV PYTHONPATH=/home/ray
After defining the Dockerfile, build and push the Docker image with the following commands.
# build the Docker image
docker build . -t my-registry/my-image:tag

# push the Docker image to your registry
docker push my-registry/my-image:tag
Next, define the service configuration with a service YAML and image_uri that points to the image. Also, define the module in exporter_import_path to load the span exporters when tracing is setup
name: tracing-service
working_dir: https://github.com/anyscale/tracing-example
image_uri: <IMAGE_URI>
applications:
- name: my_app
    route_prefix:  '/'
    import_path: serve_hello:app
    runtime_env: { }
tracing_config:
  exporter_import_path: exporter:default_tracing_exporter
  enabled: True
  sampling_ratio: 1.0
To deploy the service, we can run the following command.
anyscale service deploy -f service.yaml
After querying your application, traces will be exported to the backend defined in exporter.py.