Distributed debugger
These docs are for the new Anyscale design. If you started using Anyscale before April 2024, use Version 1.0.0 of the docs. If you're transitioning to Anyscale Preview, see the guide for how to migrate.
Interactive distributed debugging with Visual Studio Code is supported with Ray >= 2.9.0 in your workspaces. This feature allows you to break into any remote task running anywhere in your Ray cluster and perform post-mortem debugging when tasks hit an exception.
Configuration
To enable debugging, set the RAY_DEBUG environment variable in runtime_env inside ray.init.
# Make sure Ray is 2.9.0 or above.
# assert ray.__version__ >= "2.9.0"
ray.init(runtime_env={
    "env_vars": {"RAY_DEBUG": "1"},
})
Breaking into tasks with breakpoint()
You can insert a breakpoint directly into your Ray tasks using the standard Python breakpoint() method. When your code hits the breakpoint, it pauses execution, allowing you to connect with VS Code and inspect or modify the state of the program.
How to use:
- Ensure your environment is correctly set up by enabling the
RAY_DEBUGvariable and having a supported Ray version. - Insert
breakpoint()at the desired point in your Ray task. - Run your Ray application.
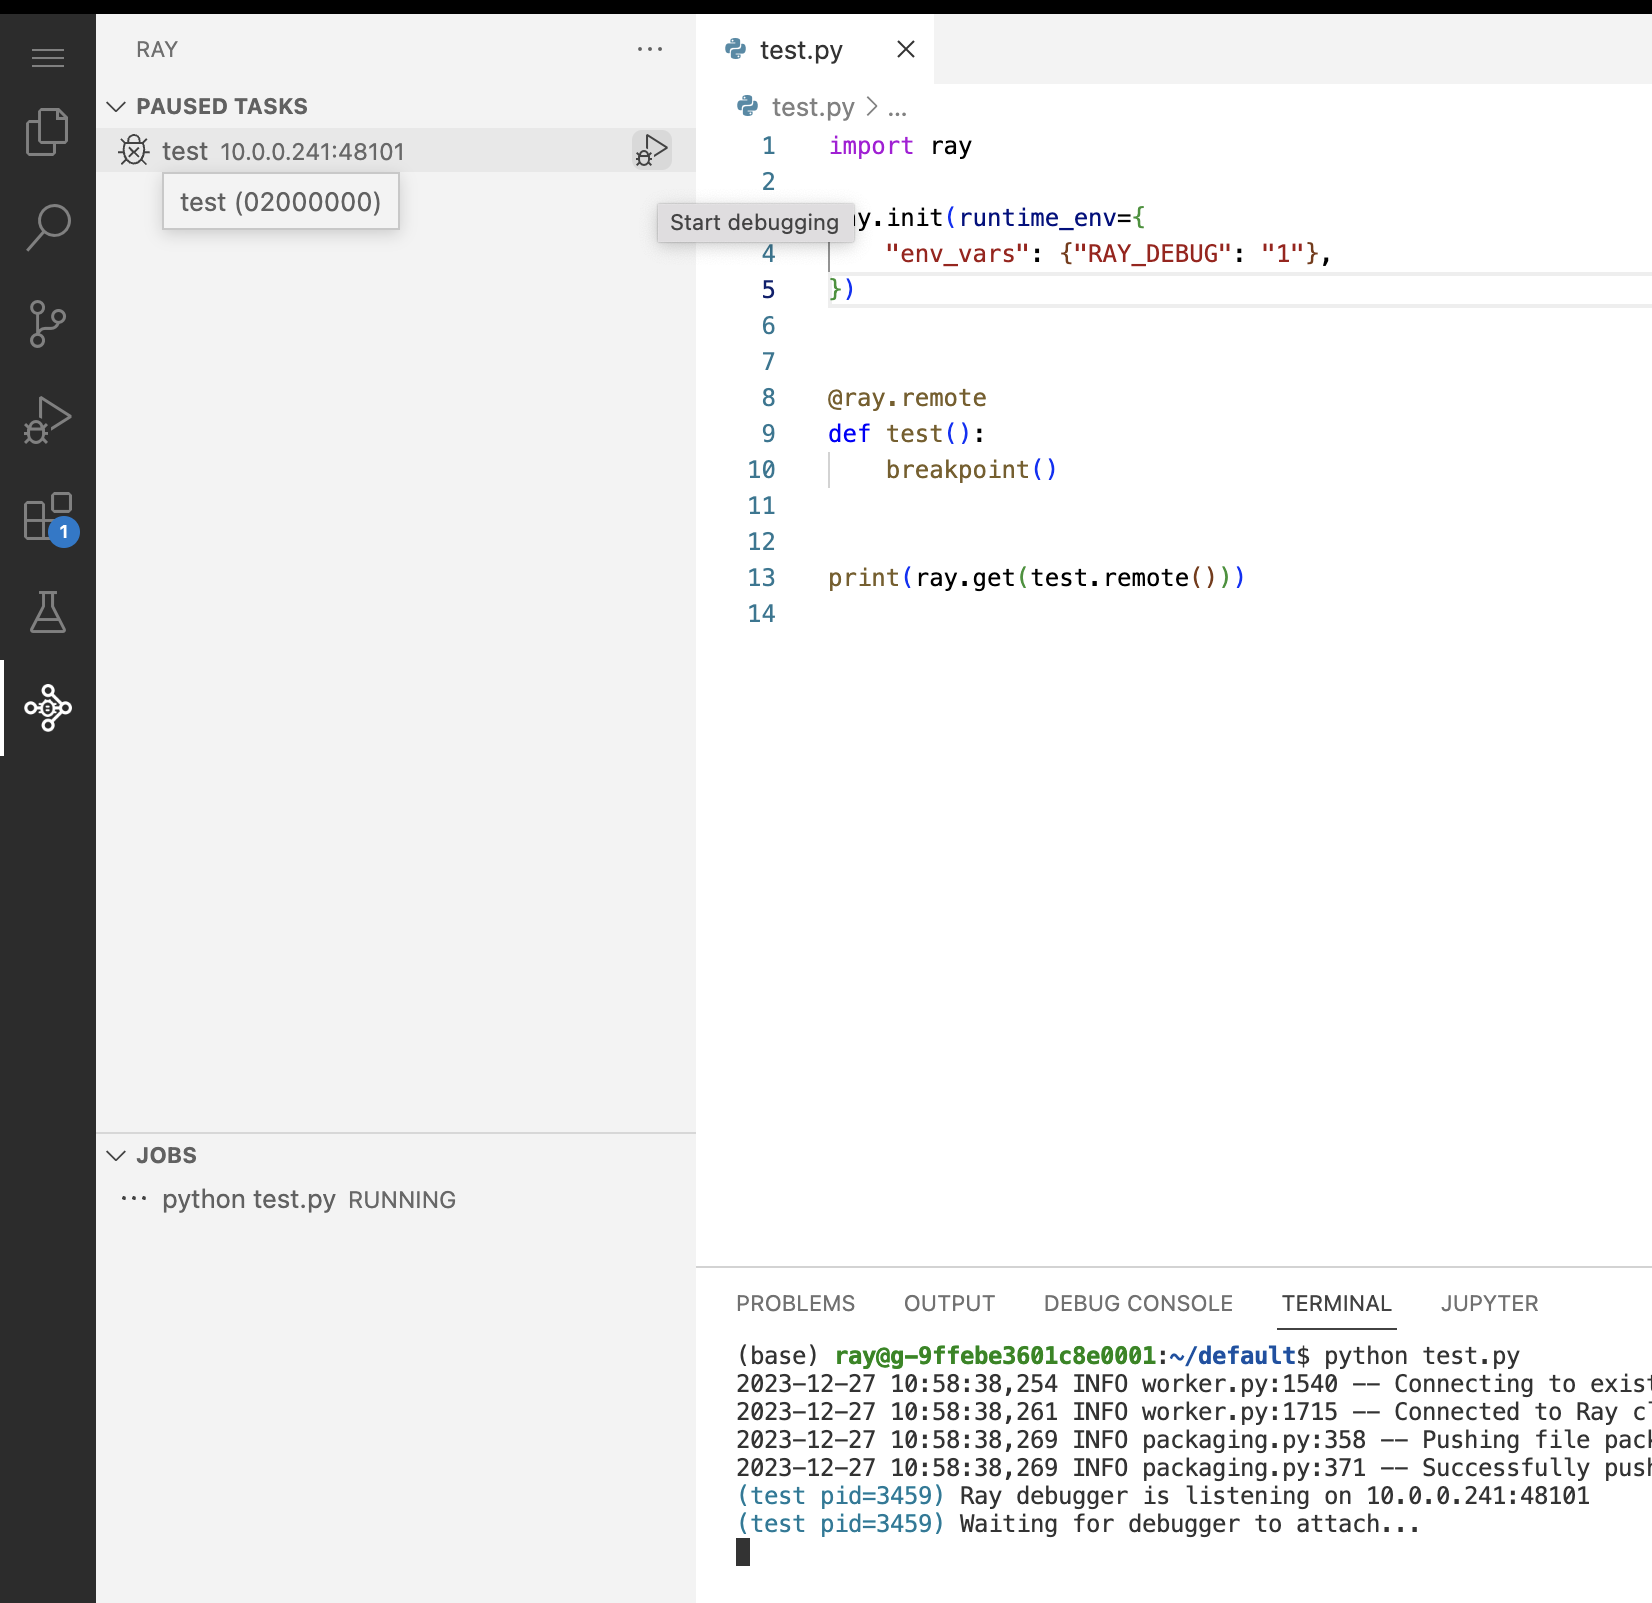
- When your program hits the breakpoint, the task enters a paused state. The terminal displays this information.
(test pid=3459) Ray debugger is listening on 10.0.0.241:48101
(test pid=3459) Waiting for debugger to attach...
- Open the Ray extension in the sidebar of VS Code, which lists paused tasks. Select the paused task you want to attach to.
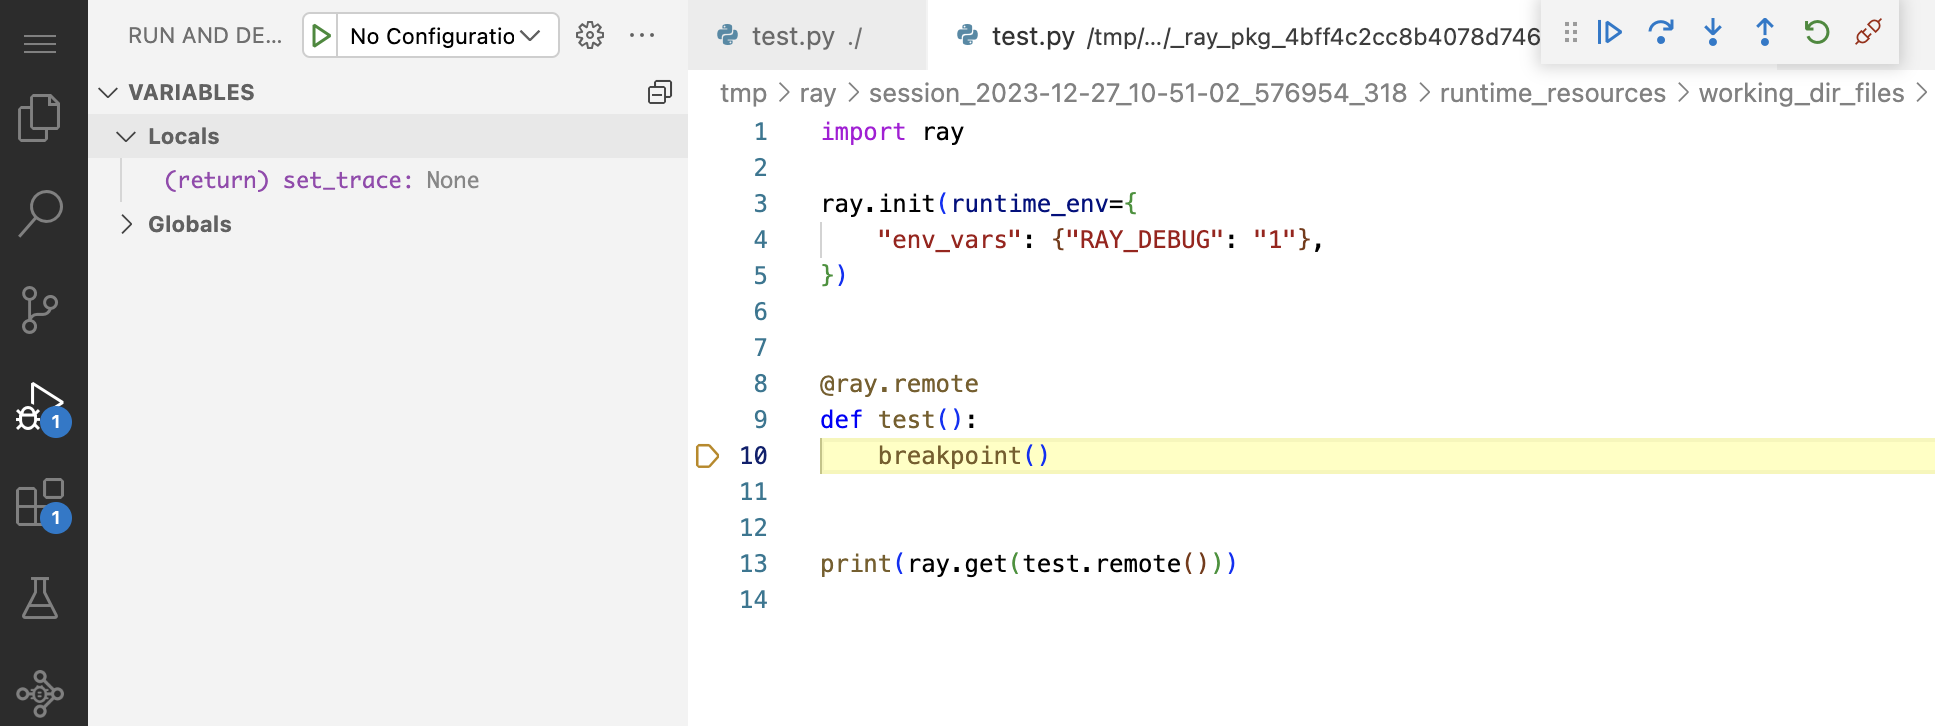
- Use the VS Code debugger like you do when developing locally.
Postmortem debugging
Postmortem debugging is crucial for diagnosing issues that cause uncaught exceptions in your tasks. When a task raises an exception, Ray freezes its state and waits for a debugger to attach, allowing you to inspect the state of the program at the time of the error.
How to use:
- Ensure your environment is correctly set up by enabling the
RAY_DEBUGvariable and having a supported Ray version. - Run your Ray application.
- When a task throws an unhandled exception, it enters a paused state. The terminal displays this information.
(test pid=3459) Ray debugger is listening on 10.0.0.241:48101
(test pid=3459) Waiting for debugger to attach...
- Open the Ray extension in the sidebar of VS Code, which lists paused tasks. Select the paused task you want to attach to.
- Use the VS Code debugger like you do when developing locally.
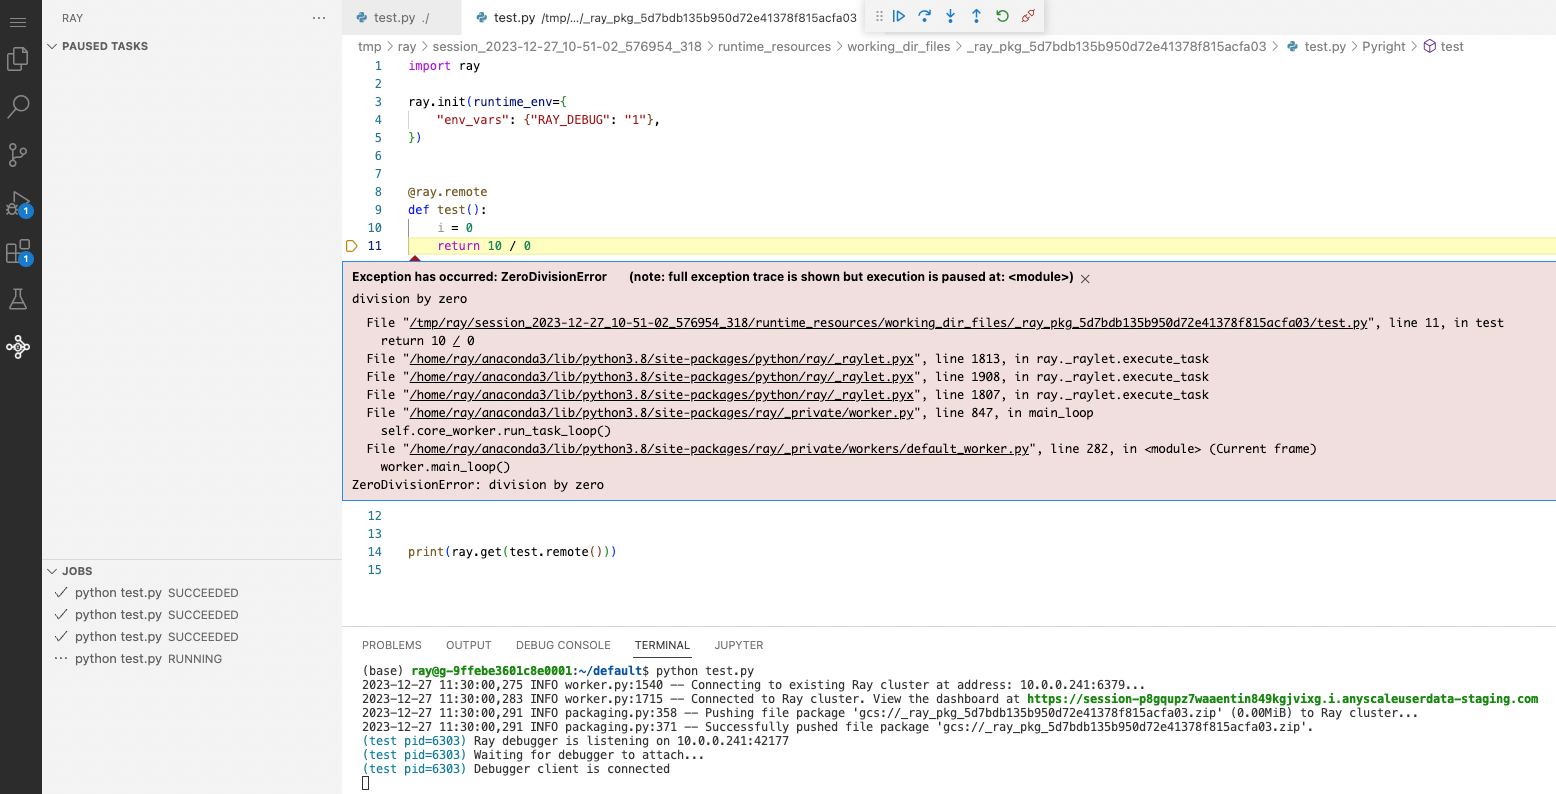
Ensure that the "unhandled exception" option is enabled in VS Code's debugger settings. This setting allows VS Code to break execution at the point where the exception occurred, enabling you to perform post-mortem analysis.