Usage dashboard
Usage dashboard
The Anyscale usage dashboard provides a centralized tool for organization owners to gain real-time insights into platform usage and cost monitoring.
Use the usage dashboard for the following:
- Monitor total Anyscale credit usage over a selected (UTC) time period.
- Identify the most expensive resources over time.
- View a detailed cost breakdown by Anyscale cloud, project, user, instance type, and clusters.
Anyscale provides usage dashboards as a convenience tool for monitoring and observability. All displayed metrics are estimates based on internal consumption metrics for your organization and your contractual agreement with Anyscale.
Any prices displayed are an estimate and might differ from your final bill. Contact Anyscale support to report and troubleshoot differences between these estimates and invoices.
Access the usage dashboard
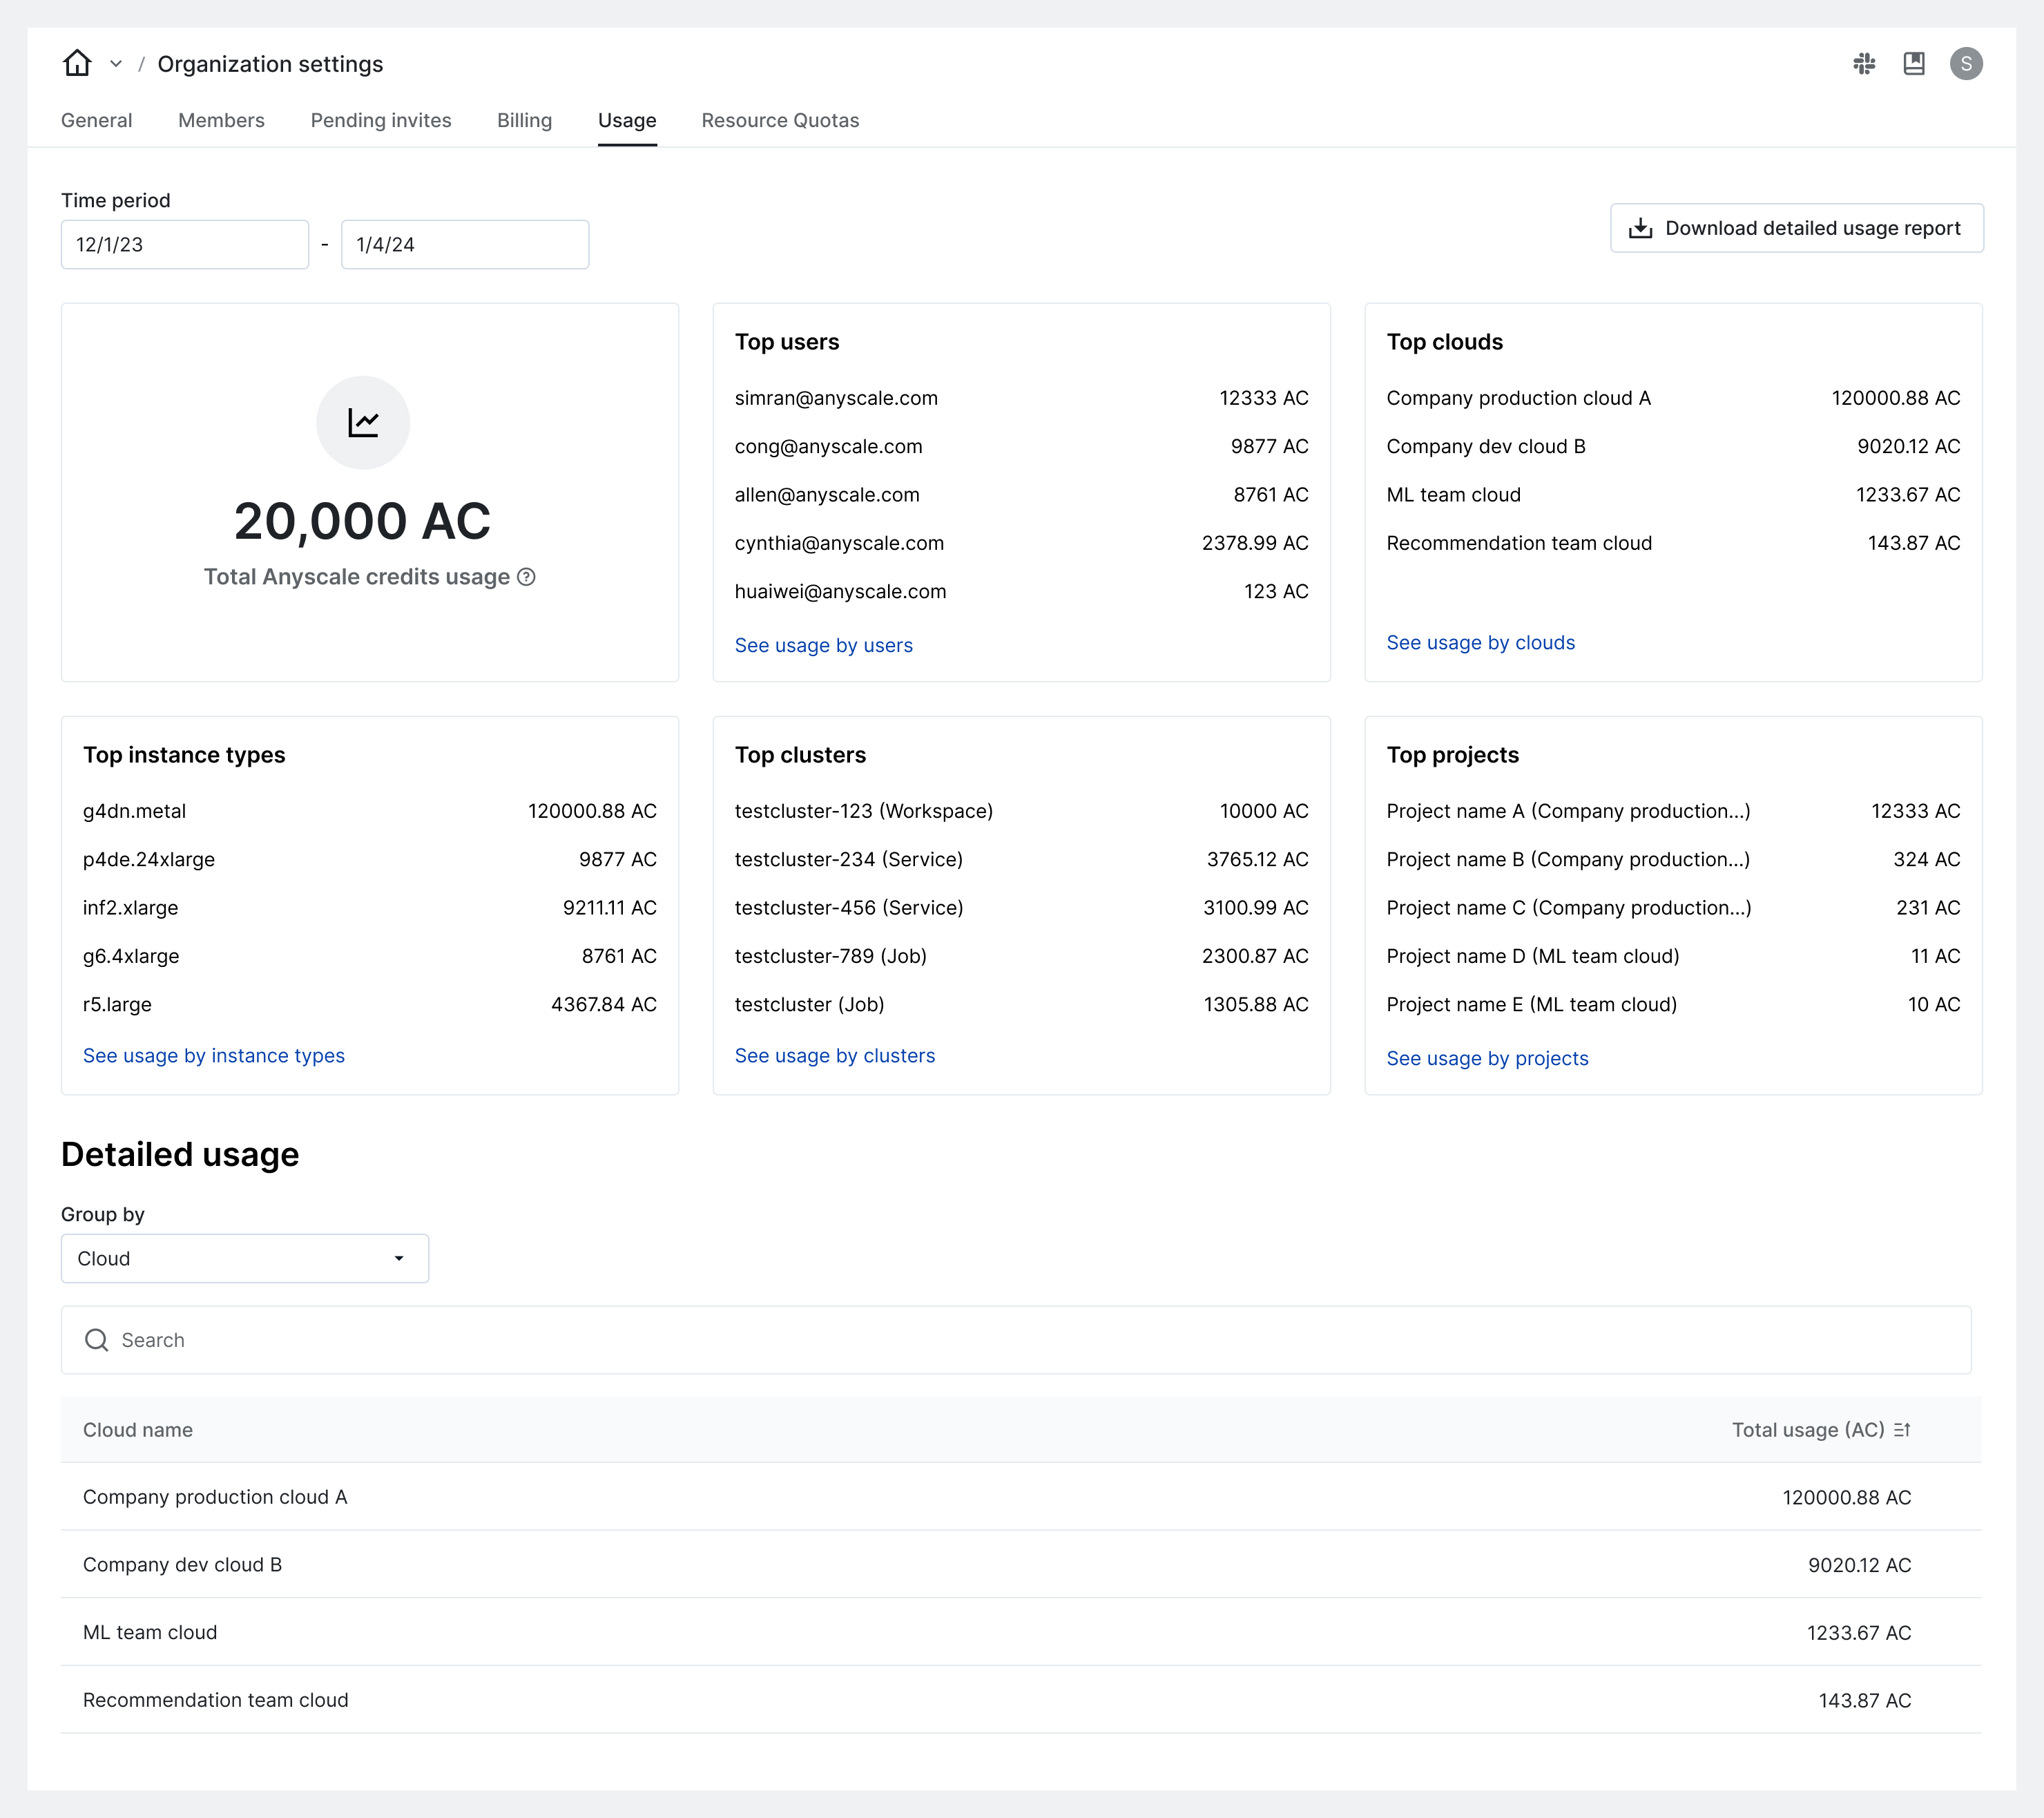
To open the usage dashboard and view your costs, go to Organization Settings > Usage.
Configure usage dashboard
By default, the usage dashboard shows metrics for the last seven days using Anyscale credits (AC). Use the provided fields to customize the dashboard.
- Use Start date and End date to select a range for your report.
- Choose $ from the Metric field to view usage in US dollars.
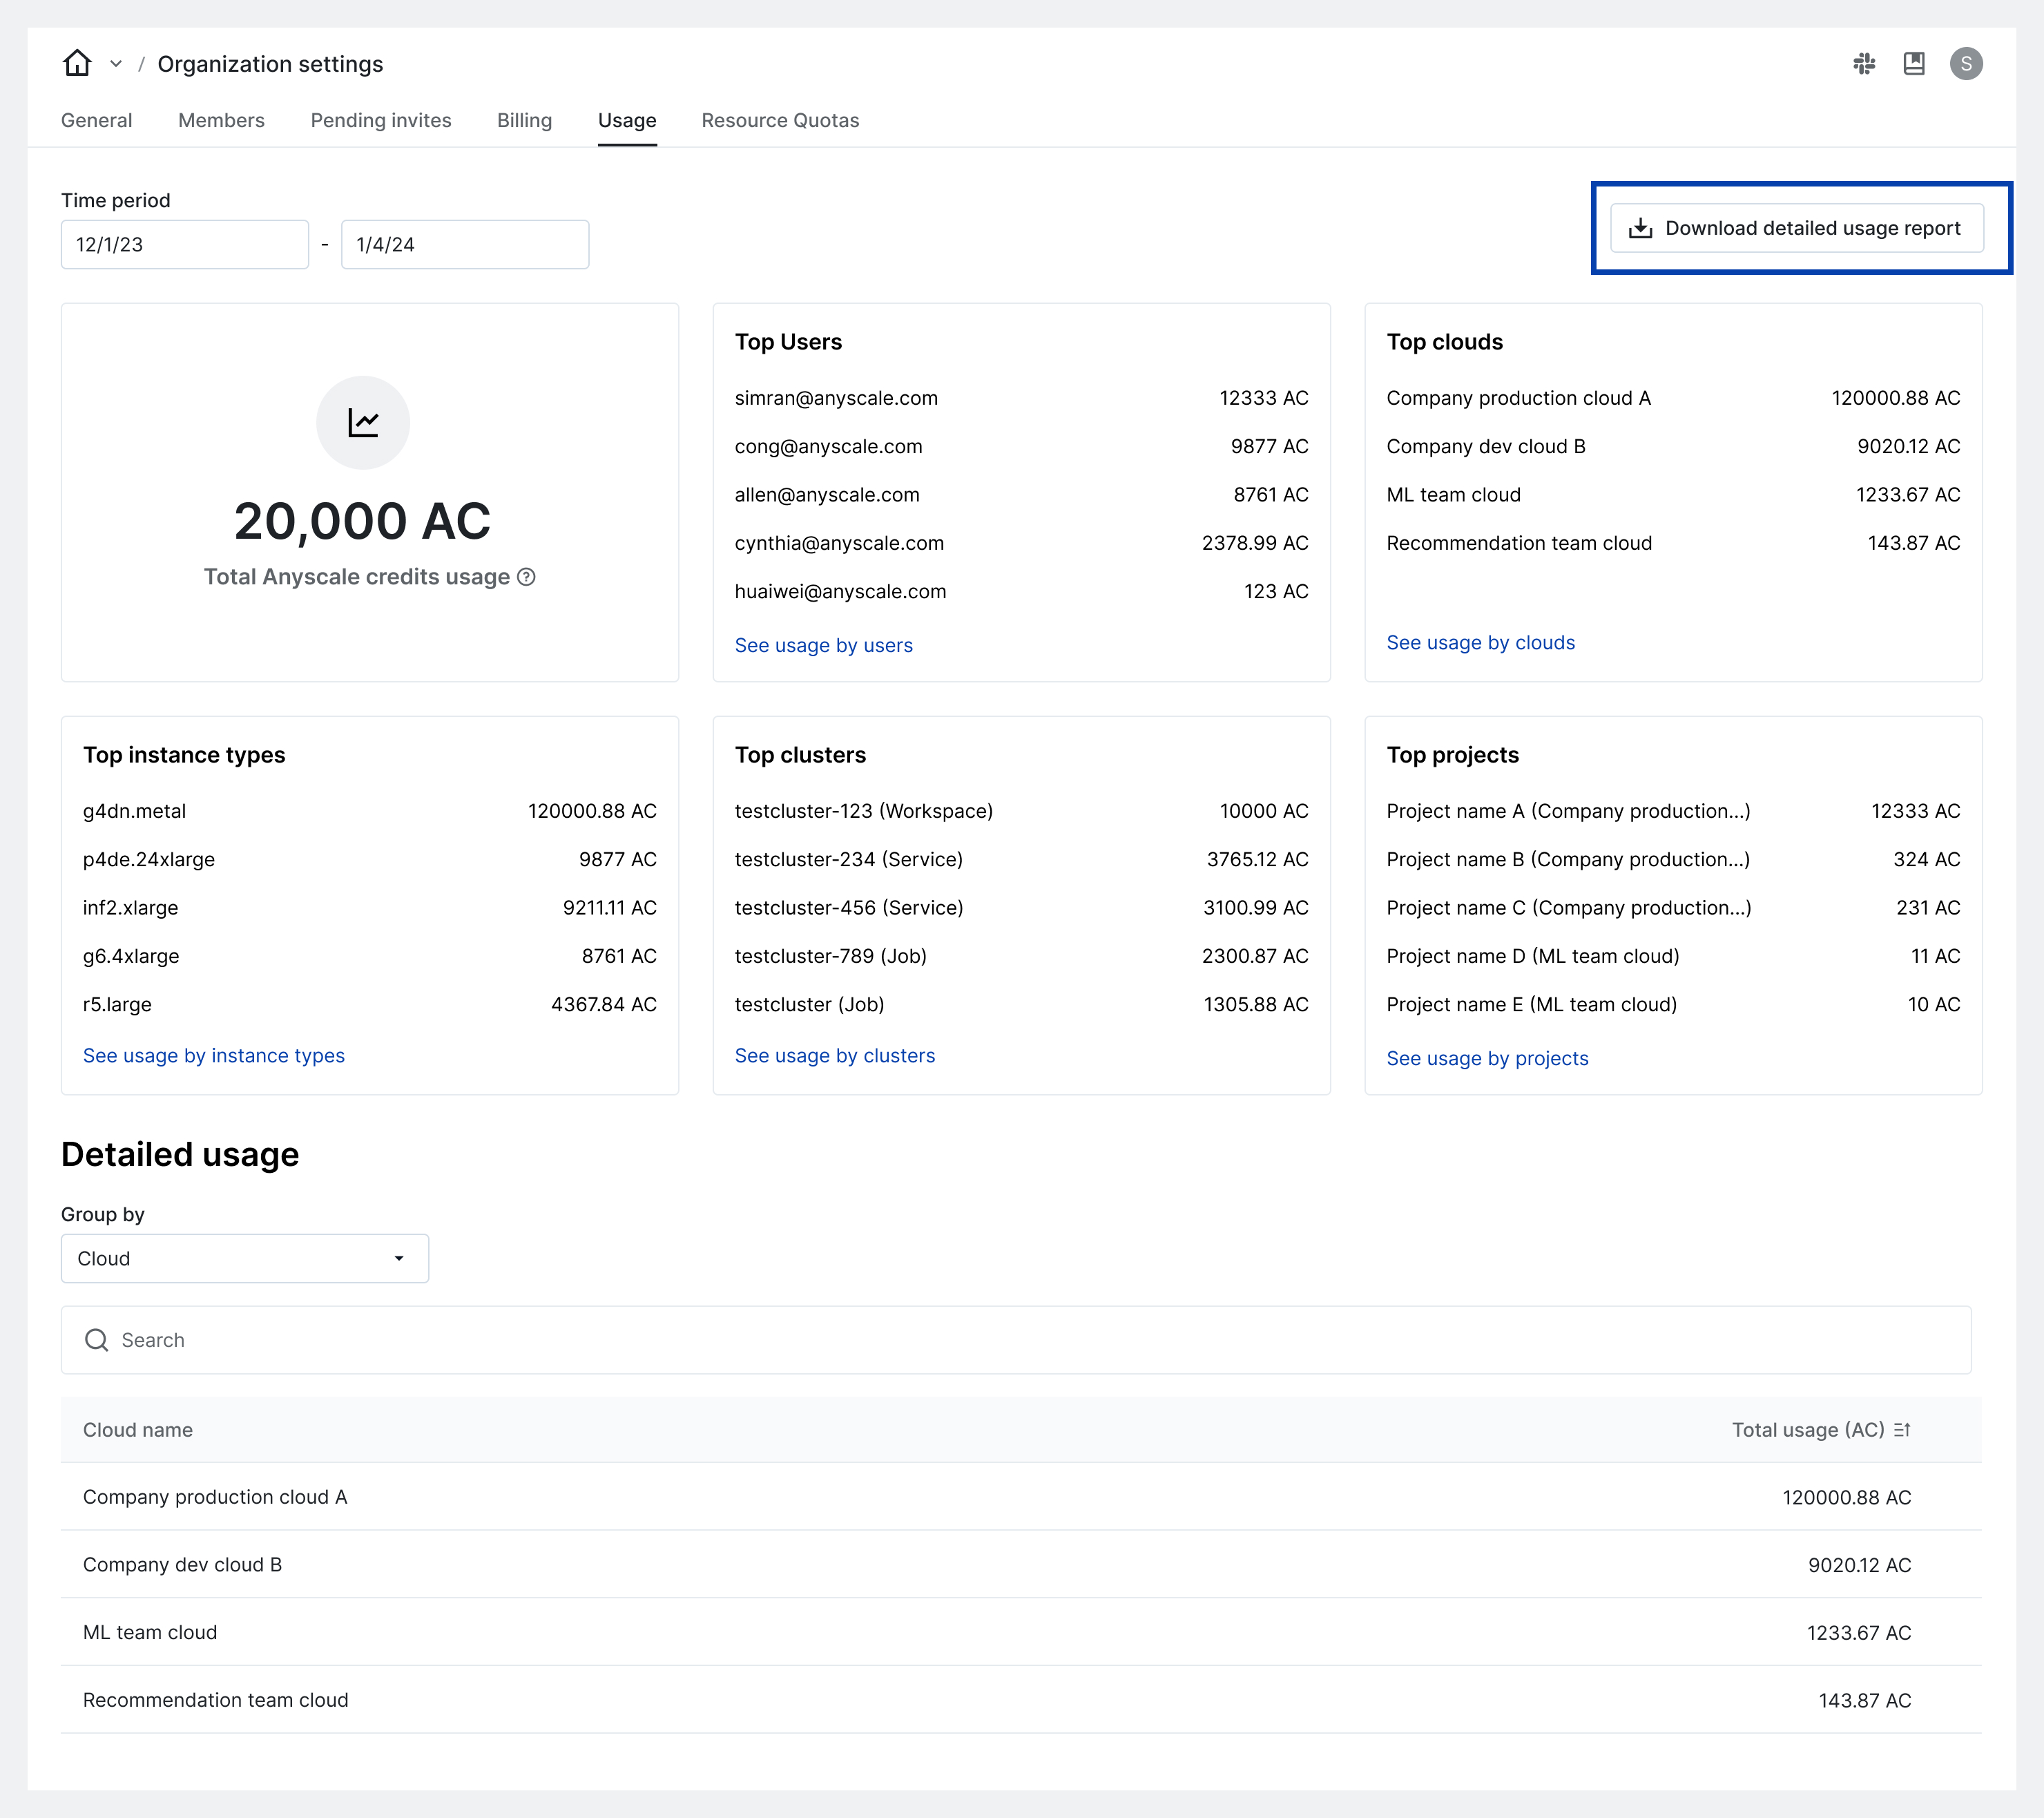
Download usage data
For deeper analysis, admins can download a detailed report of their Anyscale usage data.
To download usage data programmatically, see Aggregated instance usage CLI.
For further assistance, contact Anyscale Support.