Dashboard
Dashboard
The Dashboard page in the Anyscale console provides a high-level overview of your Ray workloads. Access the dashboard in the main navigation menu on the left side of the console. It's scoped to the selected clouds and projects.
The goal of the Dashboard is to enable tracking the health, performance, and utilization of your workloads. Use it to find places where you can optimize the speed, cost, or reliability of your workloads.
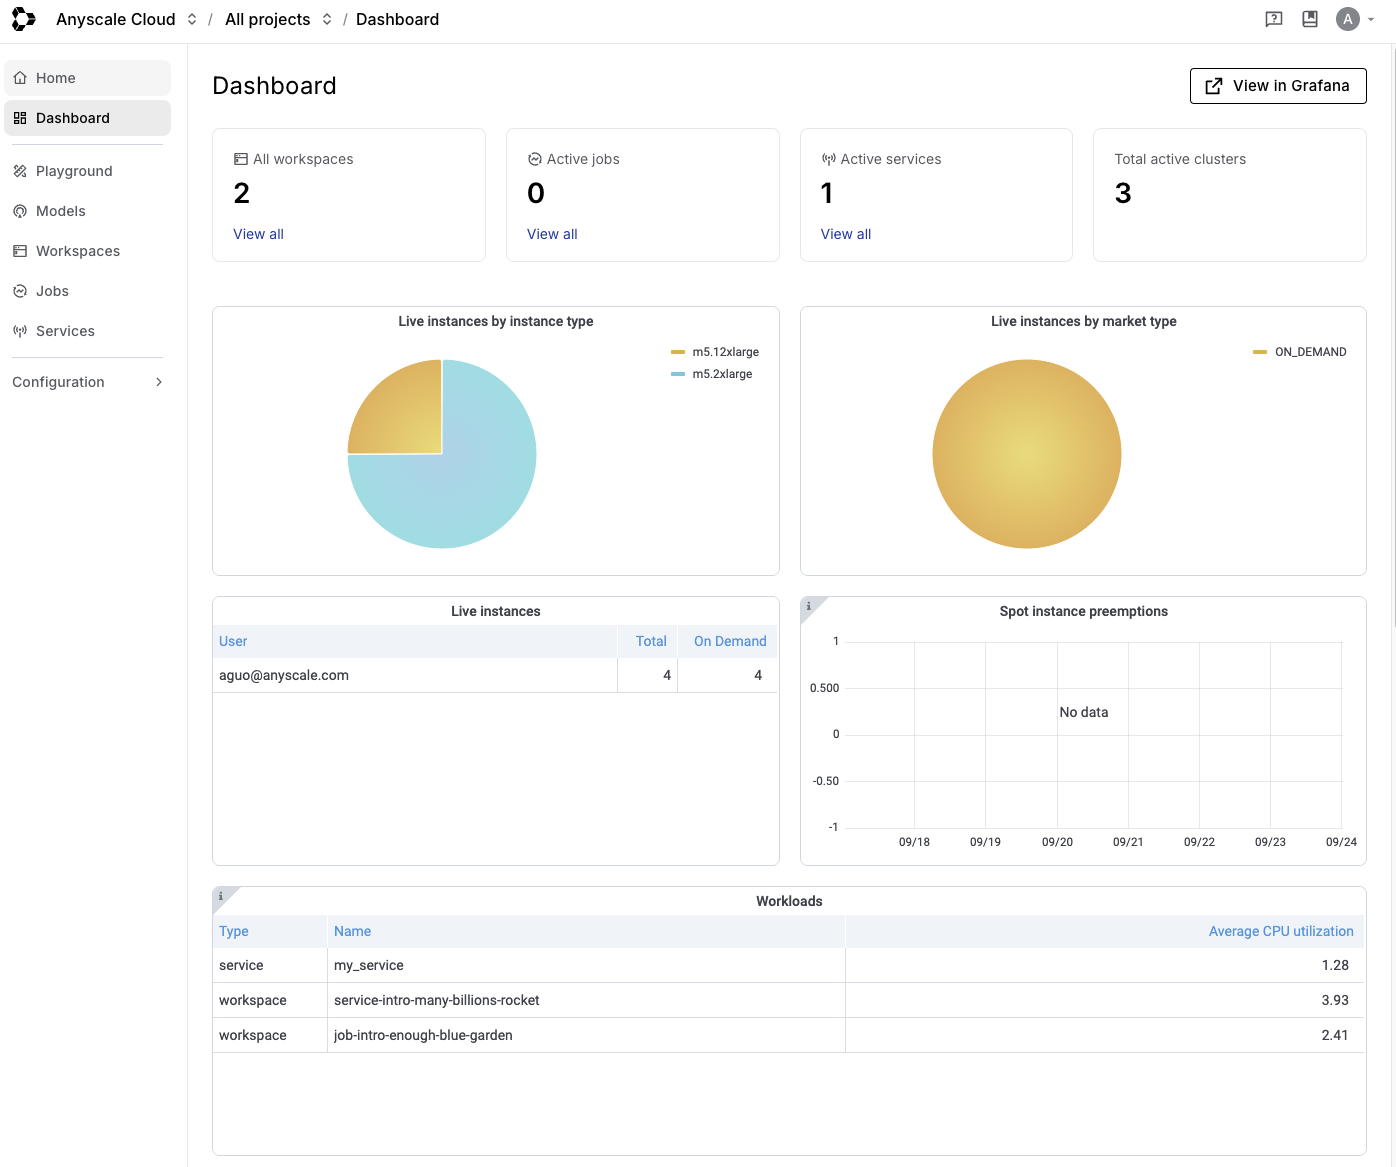
The Dashboard page displays the following information:
- High level statistics about your Ray workloads like how many running workspaces, jobs, or services.
- A summarization of the instances that your workloads are using in your cloud.
- Information about high level errors or node failures in the cloud.
- Hardware utilization across all the nodes in your cloud.
There's a link to the Grafana UI from this page to access additional metrics and dashboards. From there, you can create custom dashboards to track the health of workloads.
Alerts
For cloud-wide resource alerts, this dashboard page contains many graphs may be useful to alert on. To create an alert on one of these graphs, click the View in Grafana button to open the Grafana UI. From there, duplicate the dashboard by clicking the Save As button in the dashboard settings and saving it with a different name. This will prevent the alerts from being deleted if the dashboard gets updated by Anyscale.
From there, you can set up Grafana alerts to monitor the health of your workloads.
Example: alert on unused CPUs
As a pre-requisite, set up notification channels you want to send to. Follow the instructions in the Custom dashboards and alerting guide to set up a notification channel. A notification channel can be a Slack channel or a PagerDuty service. It only needs to be set up once.
-
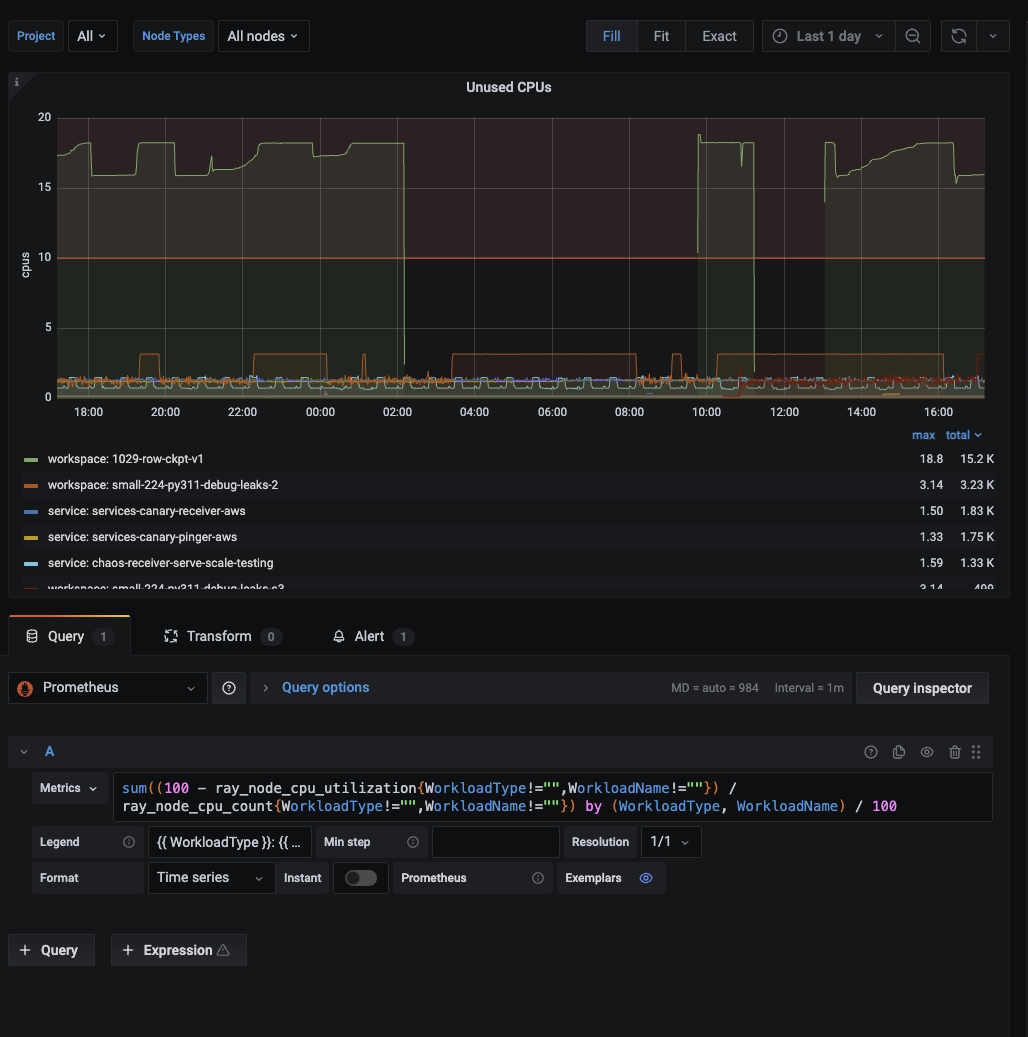
Click the dropdown menu next to the Unused CPUs graph title and select Edit.
-
In the Query tab below, remove all variables from the query. Variables are not supported by alerts in Grafana. In this case, we remove the ProjectName and IsHeadNode variables. The resulting query should be:
sum((100 - ray_node_cpu_utilization{WorkloadType!="",WorkloadName!=""}) / ray_node_cpu_count{WorkloadType!="",WorkloadName!=""}) by (WorkloadType, WorkloadName) / 100
-
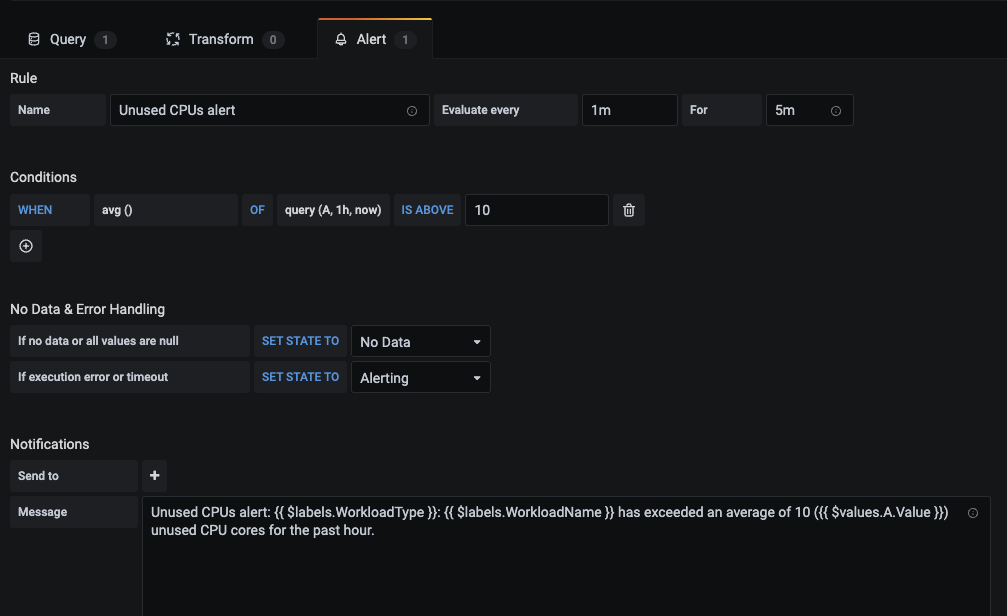
Go to the Alert tab and create a new alert. Set the Name to "Unused CPUs alert" and the Conditions to WHEN avg() OF query(A, 1h, now) IS ABOVE 10. This alert will trigger when the average number of unused CPU cores is above 10 for the past hour.
-
Under Notifications, add a notification channel to send alerts to. Enter a message which can include static text and variables. For example,
Unused CPUs alert: {{ $labels.WorkloadType }}: {{ $labels.WorkloadName }} has exceeded an average of 10 ({{ $values.A.Value }}) unused CPU cores for the past hour..