Custom dashboards and alerting
Custom dashboards and alerting
You can create custom dashboards in Grafana to visualize your metrics and set up alerts to monitor your Ray apps. This guide creates custom dashboards and sets up alerts in Grafana.
In Grafana, a dashboard is a configurable view of your metrics. You can configure which metrics you want to see, how to aggregate or group them, how to draw a visualization of those metrics, and set alerts on those metrics.
Metrics are scoped per-cloud. This means you can only visualize and aggregate metrics from a single cloud. If you wish to aggregate metrics across multiple clouds, you can follow the exporting logs and metrics guide to export your metrics to an external monitoring system.
To visit Grafana, use the View in Grafana button within the Dashboard tab of the Anyscale Console. This opens a new tab in your browser with the Grafana UI.
Creating a dashboard
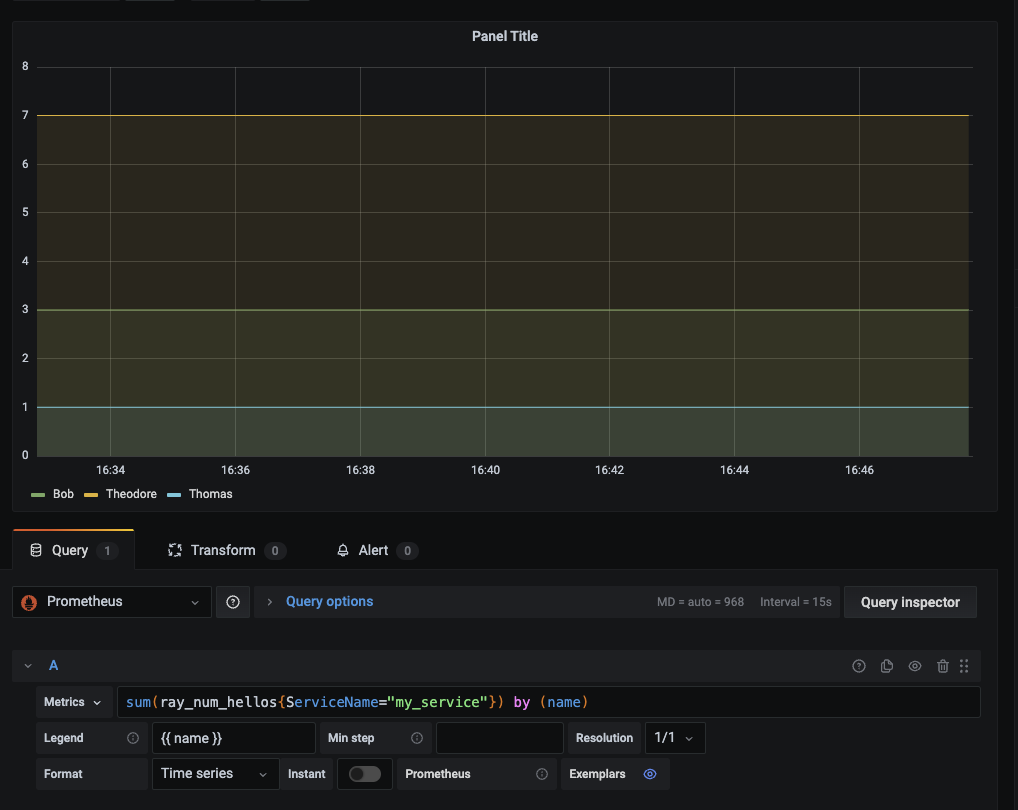
To create a dashboard, click the + icon on the left sidebar and select the "Dashboard" button. You can then add panels to the dashboard by clicking the Add panel button. With the panel editor, you can write PromQL to query metrics and configure the visualization of the metric using the panel on the right.
See Grafana dashboards and Grafana panels documentation to learn more about how to create dashboards.
By default, Grafana shows metrics of all entities in a cloud. Use filters on metric labels to target the entity you are interested in. For example, filter by WorkloadName or ServiceId to view metrics for a specific service. A list of available labels can be found in the Metrics documentation.
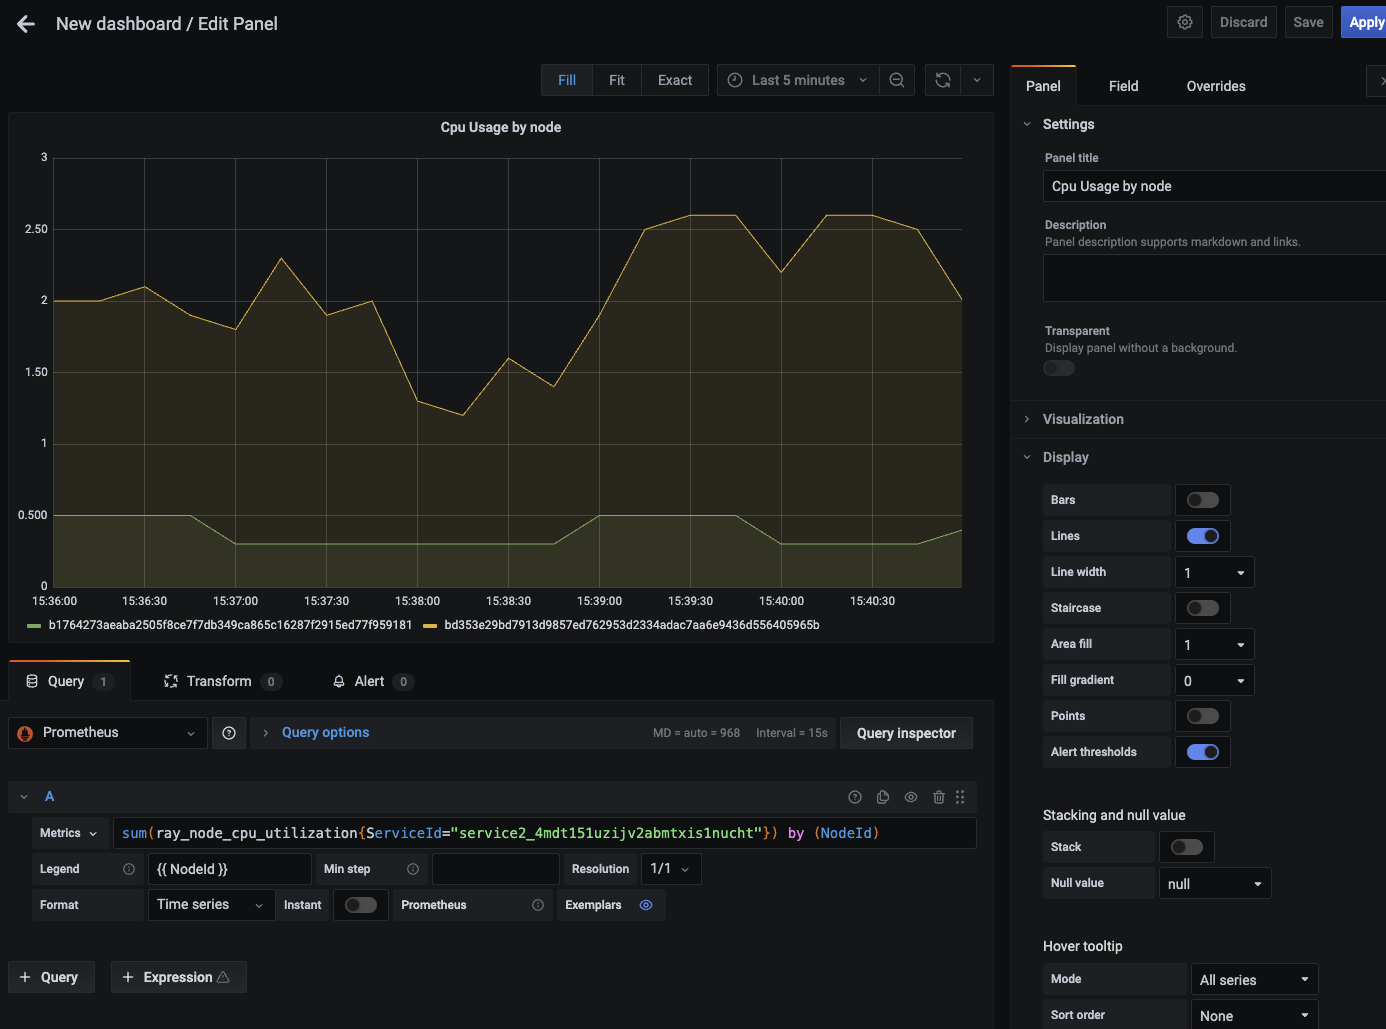
You can save the dashboard by clicking the Save button in the top right corner. Save your dashboards in the General folder to make them easier to find.
Creating a dashboard from a template
Anyscale and Ray provide a few dashboards out of the box. You can use these dashboards as starting points for creating custom dashboards. When editing dashboards, duplicate them first because Anyscale may update and replace them over time, overwriting your changes. For a full list of dashboards, see Grafana dashboards.
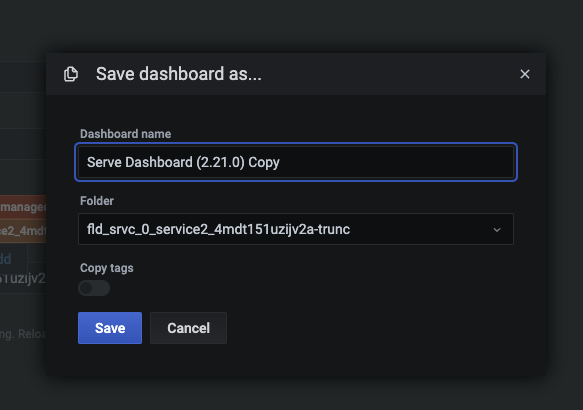
You can duplicate a dashboard by clicking on the Save As... button in the dashboard settings. Save the copy in the General folder to make it easier to find.
Viewing a dashboard
To find your dashboards, you can use the dashboard browser in the Grafana UI. Hover over the dashboards icon on the left and click the Manage button. Here, you can see all the dashboards for this cloud. You can search by name or filter by folders or tags.
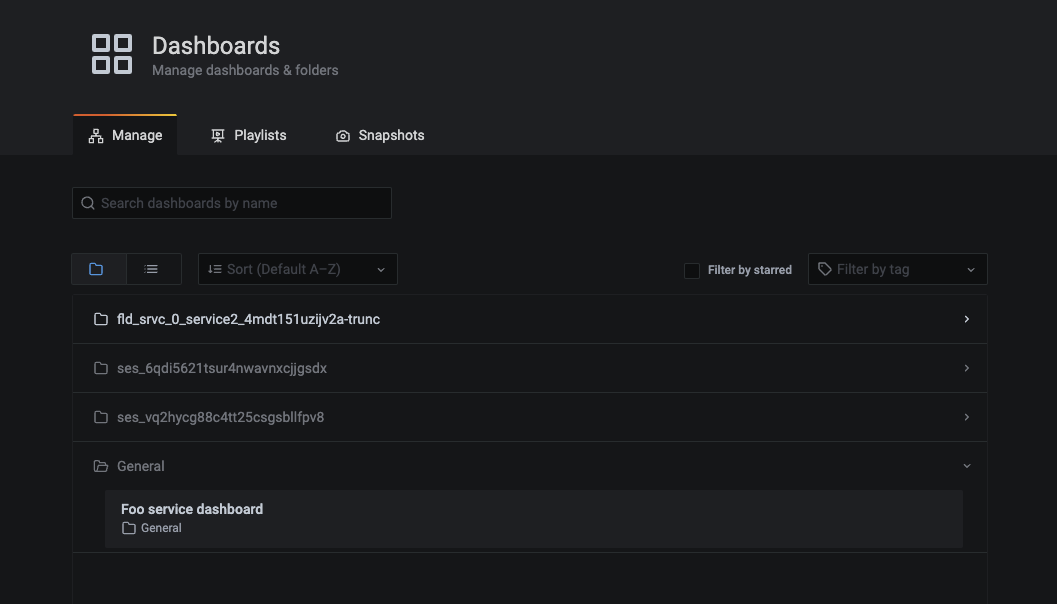
If you have a lot of dashboards, they can be hard to find. Organize them in one of two ways:
- Add tags or folders to group dashboards together
- Bookmark dashboards on your browser so you can share links with others.
Setting up alerts
Grafana has a built-in alerting system that allows you to set up alerts on metrics. These alerts can be based on the value of a metric, the rate of change of a metric, or the absence of a metric.
Set up notification channels to set up where to send the alerts. Grafana supports sending alerts to Slack, PagerDuty, and many other services. Email will be enabled as a notification channel as well in the future.
See the official Grafana documentation to learn more about how to set up alerts.
These alerts should be configured within your custom Grafana dashboards. Follow the Creating a dashboard or Creating a dashboard from a template section to create a dashboard and then add alerts to it.
Examples
Anyscale services have a Grafana dashboard with the below alerts pre-defined. They can be accessed using the Manage alerts button in the Metrics tab of the Service details page. These alerts can be further customized and are active once a notification channel is added to them.
For a step-by-step guide on how to set up alerts in Grafana, see the example below.
- Ray Serve HTTP requests route QPS alert: Alert on the rate of changes to the count of HTTP requests per route.
sum(rate(ray_serve_num_http_requests_total{route!~"/-/.*",WorkloadName=~"my_service"}[5m])) by (application, route) - Ray Serve GRPC requests route QPS alert: Alert on the rate of changes to the count of GRPC requests per route.
sum(rate(ray_serve_num_grpc_requests_total{route!~"/-/.*",WorkloadName=~"my_service"}[5m])) by (application, route) - Ray Serve endpoint latency alert: Alert on the P90 duration of requests per route.
histogram_quantile(0.9, sum(rate(ray_serve_http_request_latency_ms_bucket{application!~"",route!~"/-/.*",WorkloadName="my_service"}[5m])) by (application, route, le)) - Ray Serve endpoint error rate: Alert on the ratio of QPS of 5xx requests to QPS of all requests.
sum(rate(ray_serve_num_http_error_requests_total{route!~"/-/.*",WorkloadName="my_service",error_code=~"5.."}[5m])) by (application, route) / sum(rate(ray_serve_num_http_error_requests_total{route!~"/-/.*",WorkloadName="my_service"}[5m])) by (application, route) - Ray Serve deployment not scaling up enough to meet demand: Alert on if the number of requests in the request queue per Ray Serve deployment is too long for an extended period of time. Leave some time to allow Ray Serve to scale up the cluster by using a larger pending time configuration for your alert.
sum(ray_serve_deployment_queued_queries{WorkloadName="my_service"}) by (application, deployment) - Memory usage alert: Alert on the number of free bytes available in memory per node.
sum(ray_node_mem_used{WorkloadName="my_job_or_service"}) by (instance) - Disk space alert: Alert on the number of free bytes available on disk per node.
sum(ray_node_disk_free{WorkloadName="my_job_or_service"}) by (instance)
Dashboard to monitor the health of an Anyscale service�
Alerting on endpoint latency
First create a graph that tracks latency for all endpoints. This graph is based on the p90 latency graph provided in the default Grafana dashboard with every service.
Query: histogram_quantile(0.9, sum(rate(ray_serve_request_latency_ms_bucket{application!~"",route!~"/-/.*",WorkloadName="my_service"}[5m])) by (application, route, le))
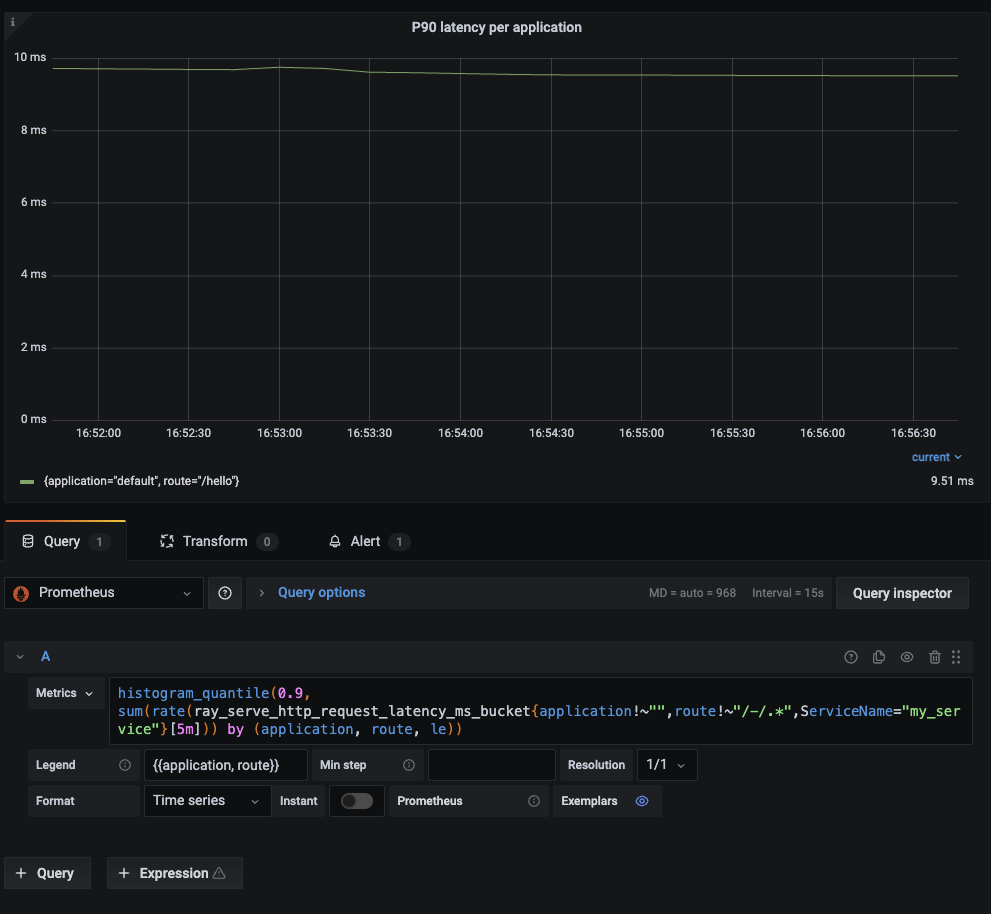
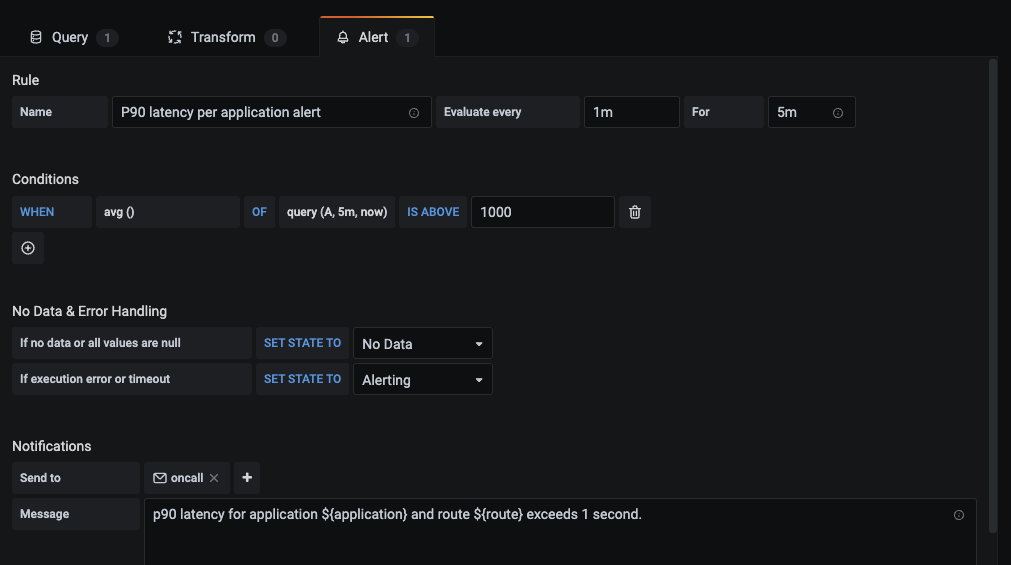
Then, set up an alert on this graph to trigger when the latency exceeds 1 second:
Alerting on endpoint error rate
First create a graph that tracks the error rate for all endpoints. This graph is based on the error rate graph provided in the default Grafana dashboard with every service
Query: sum(rate(ray_serve_num_http_error_requests_total{route!~"/-/.*",WorkloadName="my_service",error_code=~"5.."}[5m])) by (application, route)
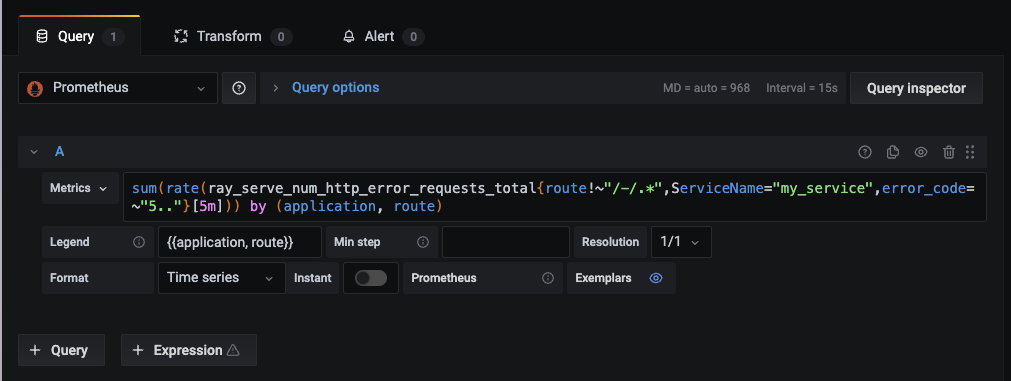
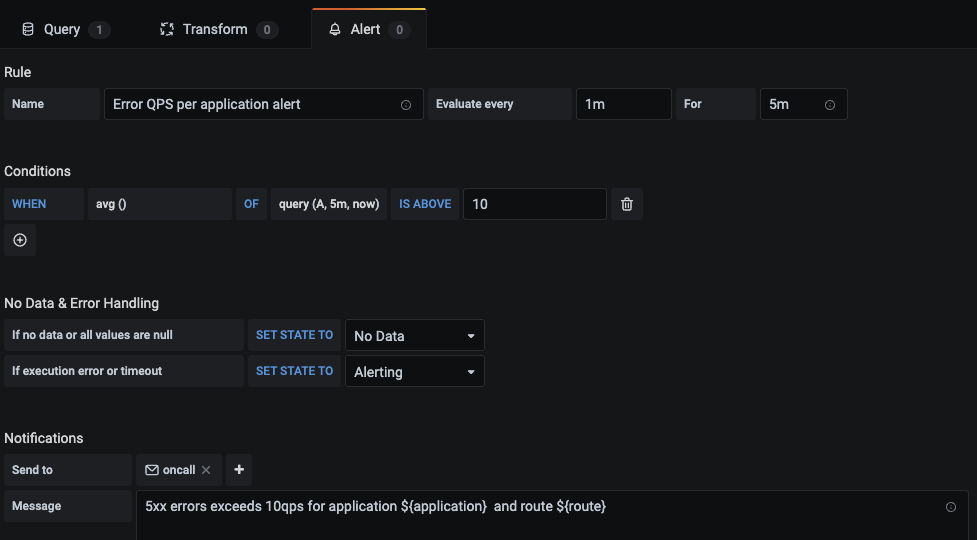
Then, set up an alert on this graph to trigger when the error rate exceeds 10qps:
Monitoring custom metrics
First define an app-level metric in your Ray Serve app:
from fastapi import FastAPI
from ray import serve
from ray.util.metrics import Counter

fastapi = FastAPI()

@serve.deployment
@serve.ingress(fastapi)
class FastAPIDeployment:
    def __init__(self):
        self.name_counter = Counter(
            name="num_hellos",
            description="Number of times someone was greeted, labeled by name",
            tag_keys=("name",)
        )

    # FastAPI automatically parses the HTTP request.
    @fastapi.get("/hello")
    def say_hello(self, name: str) -> str:
        self.name_counter.inc(tags={
            "name": name,
        })
        return f"Hello {name}!"

my_app = FastAPIDeployment.bind()
Then, add a graph for this metric in a custom Grafana dashboard:
