Tracing guide
Tracing guide
This guide provides three tutorials on how to add OpenTelemetry tracing for a Ray Serve application in an Anyscale service. The first tutorial provides a quick start on how to collect Ray Serve traces and view them in the Ray logs. The second tutorial provides a more in-depth example on how to instrument your application. The third details how to export traces to a tracing backend.
This feature is experimental, reach out with feedback or any issues encountered.
Note that by default, each request handled by the Serve application exports a trace that provides observability of the full span of the request.
You can find the code used for this tutorial in this public GitHub repo.
If you need to configure tracing for a job or workspace, see Tutorial: Export traces from Anyscale jobs and workspaces.
Quick start
Set the tracing_config in the service config.
# default_tracing_service.yaml
name: default-tracing-service
working_dir: https://github.com/anyscale/tracing-example/archive/1bf0aa2b6e846de485979e763d416a006767d793.zip
image_uri: anyscale/ray:2.55.1-slim-py310
requirements:
  - opentelemetry-api==1.26.0
  - opentelemetry-sdk==1.26.0
  - opentelemetry-exporter-otlp==1.26.0
  - opentelemetry-exporter-otlp-proto-grpc==1.26.0
  - opentelemetry-instrumentation==0.47b0
  - opentelemetry-instrumentation-asgi==0.47b0
  - opentelemetry-instrumentation-fastapi==0.47b0
applications:
- route_prefix:  '/'
  import_path: default_serve_hello:app
  runtime_env: {}
tracing_config:
  enabled: True
  sampling_ratio: 1.0
Deploy the service using the following command.
anyscale service deploy -f default_tracing_service.yaml
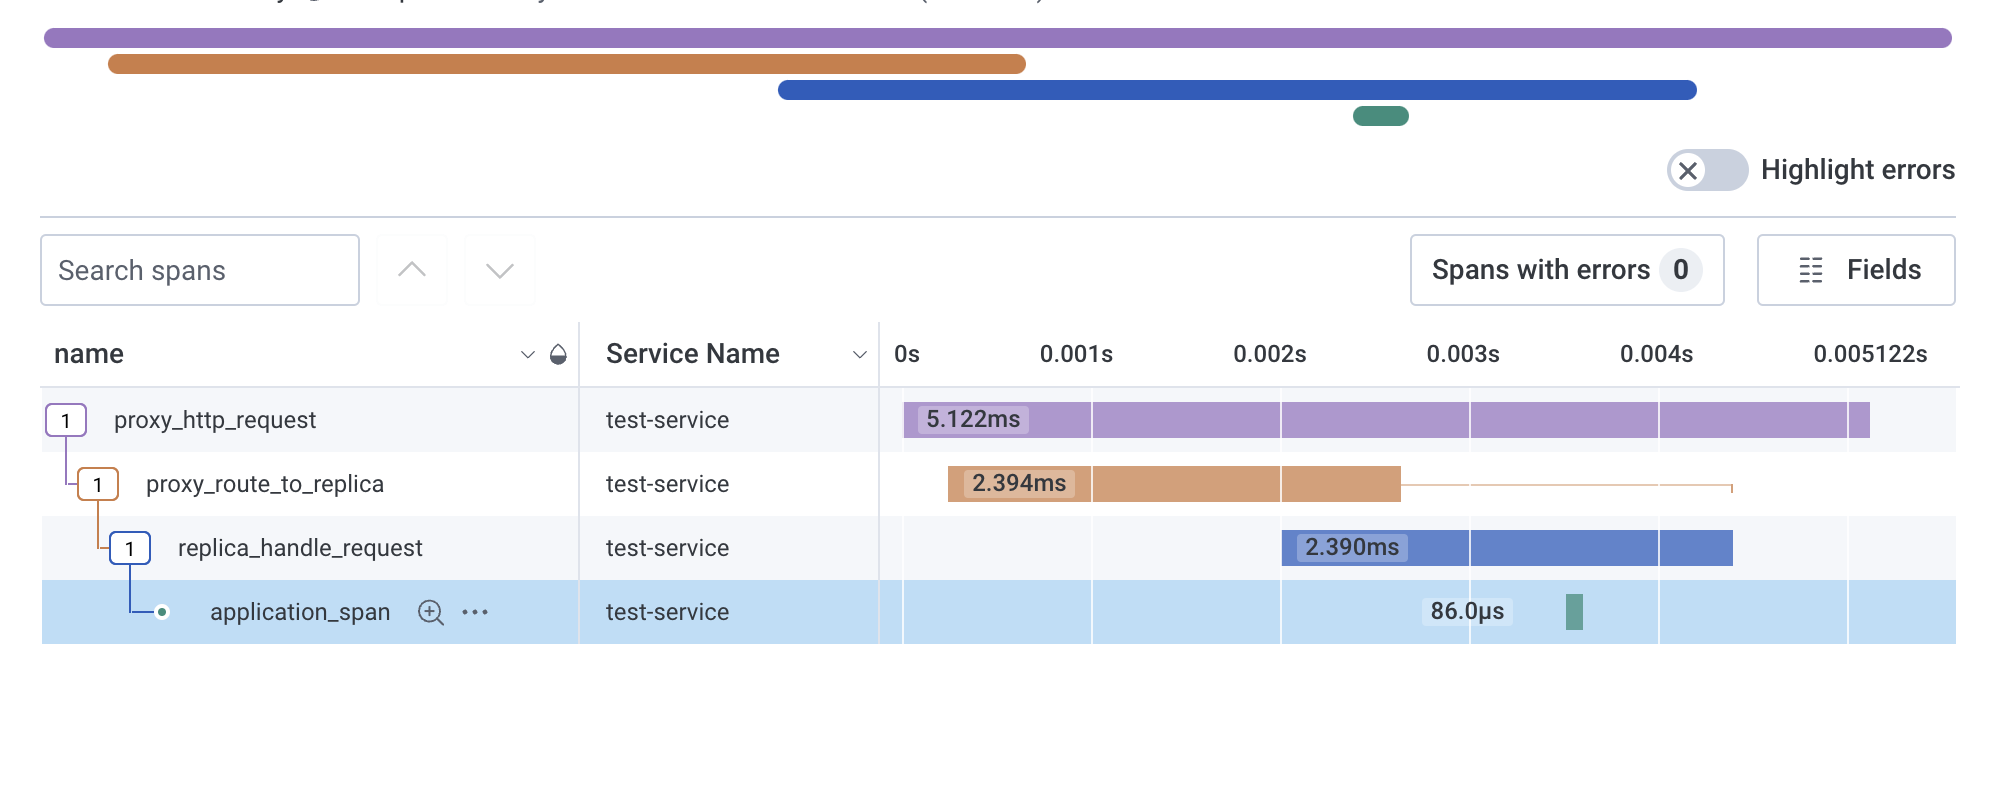
After querying your application, Anyscale exports traces to the /tmp/ray/session_latest/logs/serve/spans/ folder on instances with active replicas.
{
    "name": "proxy_http_request",
    "context": {
        "trace_id": "0x88aef1ad547167b44a15479f57a6383e",
        "span_id": "0x59989b70393625e3",
        "trace_state": "[]"
    },
    "kind": "SpanKind.SERVER",
    "parent_id": null,
    "start_time": "2024-05-28T18:05:04.864137Z",
    "end_time": "2024-05-28T18:05:04.891003Z",
    "status": {
        "status_code": "OK"
    },
    "attributes": {
        "request_id": "cf86e040-2c53-44b8-976e-55224b692141",
        "deployment": "HelloWorld",
        "app": "default",
        "request_type": "http",
        "request_method": "GET",
        "request_route_path": "/"
    },
    "events": [],
    "links": [],
    "resource": {
        "attributes": {
            "telemetry.sdk.language": "python",
            "telemetry.sdk.name": "opentelemetry",
            "telemetry.sdk.version": "1.24.0",
            "service.name": "unknown_service"
        },
        "schema_url": ""
    }
}
Instrumenting a Serve application
This tutorial provides guidance on how to instrument a Serve app with custom tracing and third party OpenTelemetry compatible instrumentors.
The first step is augmenting the Serve application with OpenTelemetry traces and the FastAPIInstrumentor.
If you use FastAPIInstrumentor with Ray Serve, you may encounter serialization errors. This happens because FastAPIInstrumentor uses non-serializable components such as thread locks, and Ray Serve must serialize the FastAPI app object when distributing it to replicas.
To avoid this issue, use the FastAPI factory pattern. Instead of passing a FastAPI app object to @serve.ingress, pass a factory function that creates and instruments the app. This way, each replica creates the app directly, avoiding serialization.
# serve_hello.py
from fastapi import FastAPI
from opentelemetry import trace
from opentelemetry.trace.status import Status, StatusCode
from opentelemetry.instrumentation.fastapi import FastAPIInstrumentor
from ray import serve
from ray.anyscale.serve._private.tracing_utils import get_trace_context


def fastapi_app_factory():
    """Factory function that creates and instruments the FastAPI app.

    Creating the app inside a factory avoids serialization issues
    with FastAPIInstrumentor.
    """
    app = FastAPI()
    FastAPIInstrumentor.instrument_app(app)

    @app.get("/")
    async def hello():
        # Create a new span that is associated with the current trace.
        tracer = trace.get_tracer(__name__)
        with tracer.start_as_current_span(
            "application_span", context=get_trace_context()
        ) as span:
            replica_context = serve.get_replica_context()
            # Update the span attributes and status.
            attributes = {
                "deployment": replica_context.deployment,
                "replica_id": replica_context.replica_id.unique_id
            }
            span.set_attributes(attributes)
            span.set_status(
                Status(status_code=StatusCode.OK)
            )

            return "Hello world!"

    return app


@serve.deployment
@serve.ingress(fastapi_app_factory)
class HelloWorld:
    pass


app = HelloWorld.bind()
Next, define the service configuration with a service YAML.
# tracing_service.yaml
name: tracing-service
working_dir: https://github.com/anyscale/tracing-example/archive/1bf0aa2b6e846de485979e763d416a006767d793.zip
image_uri: anyscale/ray:2.55.1-slim-py310
requirements:
  - opentelemetry-api==1.26.0
  - opentelemetry-sdk==1.26.0
  - opentelemetry-exporter-otlp==1.26.0
  - opentelemetry-exporter-otlp-proto-grpc==1.26.0
  - opentelemetry-instrumentation==0.47b0
  - opentelemetry-instrumentation-asgi==0.47b0
  - opentelemetry-instrumentation-fastapi==0.47b0
applications:
- name: my_app
  route_prefix:  '/'
  import_path: serve_hello:app
  runtime_env: {}
tracing_config:
  enabled: True
  sampling_ratio: 1.0
To deploy the service, we can run the following command.
anyscale service deploy -f tracing_service.yaml
After querying your application, Anyscale exports traces to the /tmp/ray/session_latest/logs/serve/spans/ folder on instances with active replicas.
{
    "name": "application_span",
    "context": {
        "trace_id": "0xff1e005576c03988af36a72bb53af9b0",
        "span_id": "0xadf6ad79766eb568",
        "trace_state": "[]"
    },
    "kind": "SpanKind.INTERNAL",
    "parent_id": "0xdf94f8c2dbf8f6ff",
    "start_time": "2024-06-04T20:52:12.558024Z",
    "end_time": "2024-06-04T20:52:12.558047Z",
    "status": {
        "status_code": "OK"
    },
    "attributes": {
        "deployment": "HelloWorld",
        "replica_id": "7u8nq1c3"
    },
    "events": [],
    "links": [],
    "resource": {
        "attributes": {
            "telemetry.sdk.language": "python",
            "telemetry.sdk.name": "opentelemetry",
            "telemetry.sdk.version": "1.24.0",
            "service.name": "unknown_service"
        },
        "schema_url": ""
    }
}
{
    "name": "GET / http send",
    "context": {
        "trace_id": "0xd02e60adebf4010d29f7057b373224f9",
        "span_id": "0x13dec7bea39c7d48",
        "trace_state": "[]"
    },
    "kind": "SpanKind.INTERNAL",
    "parent_id": "0x288b70e107316859",
    "start_time": "2024-06-04T20:52:12.558452Z",
    "end_time": "2024-06-04T20:52:12.558489Z",
    "status": {
        "status_code": "UNSET"
    },
    "attributes": {
        "http.status_code": 200,
        "type": "http.response.start"
    },
    "events": [],
    "links": [],
    "resource": {
        "attributes": {
            "telemetry.sdk.language": "python",
            "telemetry.sdk.name": "opentelemetry",
            "telemetry.sdk.version": "1.24.0",
            "service.name": "unknown_service"
        },
        "schema_url": ""
    }
}
Defining a custom exporter
This tutorial provides guidance on how to export the OpenTelemetry traces to a tracing backend. This will require defining an OpenTelemetry compatible exporter inside a Docker image and referencing that exporter inside the service YAML.
Build an image containing an OpenTelemetry compatible exporter
To export traces to a tracing backend, we need to define a tracing exporter function in exporter.py. The tracing exporter needs to be a Python function that takes no arguments and returns a list of type SpanProcessor. Note, you can configure this function to return several span processors so traces are exported to multiple backends.
import os

from opentelemetry.ext.honeycomb import HoneycombSpanExporter
from opentelemetry.sdk.trace import SpanProcessor
from opentelemetry.sdk.trace.export import BatchSpanProcessor
from typing import List

# Replace those with the actual values.
HONEYCOMB_SERVICE_NAME = os.getenv("HONEYCOMB_SERVICE_NAME", "")
HONEYCOMB_WRITE_KEY = os.getenv("HONEYCOMB_WRITE_KEY", "")
HONEYCOMB_DATASET_NAME = os.getenv("HONEYCOMB_DATASET_NAME", "")


def default_tracing_exporter() -> List[SpanProcessor]:
    exporter = HoneycombSpanExporter(
        service_name=HONEYCOMB_SERVICE_NAME,
        writekey=HONEYCOMB_WRITE_KEY,
        dataset=HONEYCOMB_DATASET_NAME,
    )
    return [BatchSpanProcessor(exporter)]
Then define a Dockerfile and environment dependencies.
# requirements.txt
asgiref==3.8.1
deprecated==1.2.14
importlib-metadata==8.2.0
libhoney==2.4.0
opentelemetry-api==1.25.0
opentelemetry-ext-honeycomb==1.3.0
opentelemetry-instrumentation==0.46b0
opentelemetry-instrumentation-asgi==0.46b0
opentelemetry-instrumentation-fastapi==0.45b0
opentelemetry-sdk==1.25.0
opentelemetry-semantic-conventions==0.46b0
opentelemetry-util-http==0.46b0
statsd==4.0.1
zipp==3.20.0
# Use Anyscale base image
FROM anyscale/ray:2.55.1-slim-py310

# Copy the requirements file into the Docker image
COPY requirements.txt .

# Install all dependencies specified in requirements.txt
RUN pip install --no-cache-dir  --no-dependencies -r requirements.txt

# Copy exporter file and application definitions into the Docker image
COPY exporter.py /home/ray/exporter.py
COPY serve_hello.py /home/ray/serve_hello.py

# Set environment variables for Honeycomb
ENV HONEYCOMB_SERVICE_NAME="my-service-name"
ENV HONEYCOMB_WRITE_KEY="xxxxxxxxxxxxxxxxxxxxxx"
ENV HONEYCOMB_DATASET_NAME="my-dataset-name"

# Add working directory into python path so they are importable
ENV PYTHONPATH=/home/ray
After defining the Dockerfile, build and push the Docker image with the following commands.
# build the Docker image
docker build . -t my-registry/my-image:tag

# push the Docker image to your registry
docker push my-registry/my-image:tag
Next, define the service configuration with a service YAML and image_uri that points to the image. Also, define the module in exporter_import_path to load the span exporters when tracing is setup
# tracing_service_with_exporter.yaml
name: tracing-service-with-exporter
image_uri: <IMAGE_URI>
applications:
- name: my_app
  route_prefix:  '/'
  import_path: serve_hello:app
  runtime_env: {}
tracing_config:
  exporter_import_path: exporter:default_tracing_exporter
  enabled: True
  sampling_ratio: 1.0
To deploy the service, we can run the following command.
anyscale service deploy -f tracing_service_with_exporter.yaml
After querying your application, Anyscale exports traces to the backend defined in exporter.py.
Propagate traces between services
To properly propagate traces between upstream and downstream services, you need to ensure that traceparent is passed in the headers of the request. TraceContextTextMapPropagator().inject() serializes the trace context and add the proper traceparent to the header object. The following code snippet demonstrates how to propagate traces between two services.
# serve_call_external_service.py
import asyncio
import requests
from opentelemetry import trace
from opentelemetry.trace.propagation.tracecontext import (
    TraceContextTextMapPropagator,
)
from opentelemetry.trace.status import Status, StatusCode
from ray import serve
from ray.anyscale.serve._private.tracing_utils import (
    get_trace_context,
)
from starlette.requests import Request


@serve.deployment
class UpstreamApp:
    def __call__(self, request: Request):
        # Create a new span associated with the current trace.
        tracer = trace.get_tracer(__name__)
        with tracer.start_as_current_span(
                "upstream_application_span", context=get_trace_context()
        ) as span:
            url = f"{str(request.url).replace('http://', 'https://')}downstream"
            headers = {"Authorization": request.headers.get("authorization")}

            # Inject the trace context into the headers to propagate it downstream.
            ctx = get_trace_context()
            TraceContextTextMapPropagator().inject(headers, ctx)

            # Go out to network to call the downstream service.
            resp = requests.get(url, headers=headers)

            replica_context = serve.get_replica_context()
            # Update the span attributes and status.
            attributes = {
                "deployment": replica_context.deployment,
                "replica_id": replica_context.replica_id.unique_id
            }
            span.set_attributes(attributes)
            span.set_status(
                Status(status_code=StatusCode.OK)
            )

            # Return message.
            return {
                "upstream_message": "Hello world from UpstreamApp!",
                "downstream_message": resp.text,
            }


@serve.deployment
class DownstreamApp:
    async def __call__(self):
        # Create a new span associated with the current trace.
        tracer = trace.get_tracer(__name__)
        with tracer.start_as_current_span(
                "downstream_application_span", context=get_trace_context()
        ) as span:
            replica_context = serve.get_replica_context()
            # Update the span attributes and status.
            attributes = {
                "deployment": replica_context.deployment,
                "replica_id": replica_context.replica_id.unique_id
            }
            span.set_attributes(attributes)
            span.set_status(
                Status(status_code=StatusCode.OK)
            )

            # Simulate some work.
            await asyncio.sleep(0.5)

            # Return message.
            return "Hello world from DownstreamApp!"


upstream_app = UpstreamApp.bind()
downstream_app = DownstreamApp.bind()
Define the service configuration with a service YAML like below. This service creates two endpoints, one for the upstream service and one for the downstream service. The traces continue to export to the backend defined in exporter.py from the previous section.
# tracing_upstream_downstream_service.yaml
name: tracing-upstream-downstream-service
image_uri: <IMAGE_URI>
applications:
  - name: app
    route_prefix: /
    import_path: serve_call_external_service:upstream_app
    runtime_env: {}
  - name: app2
    route_prefix: /downstream
    import_path: serve_call_external_service:downstream_app
    runtime_env: {}
tracing_config:
  exporter_import_path: exporter:default_tracing_exporter
  enabled: True
  sampling_ratio: 1.0
To deploy the service, run the following command:
anyscale service deploy -f tracing_upstream_downstream_service.yaml
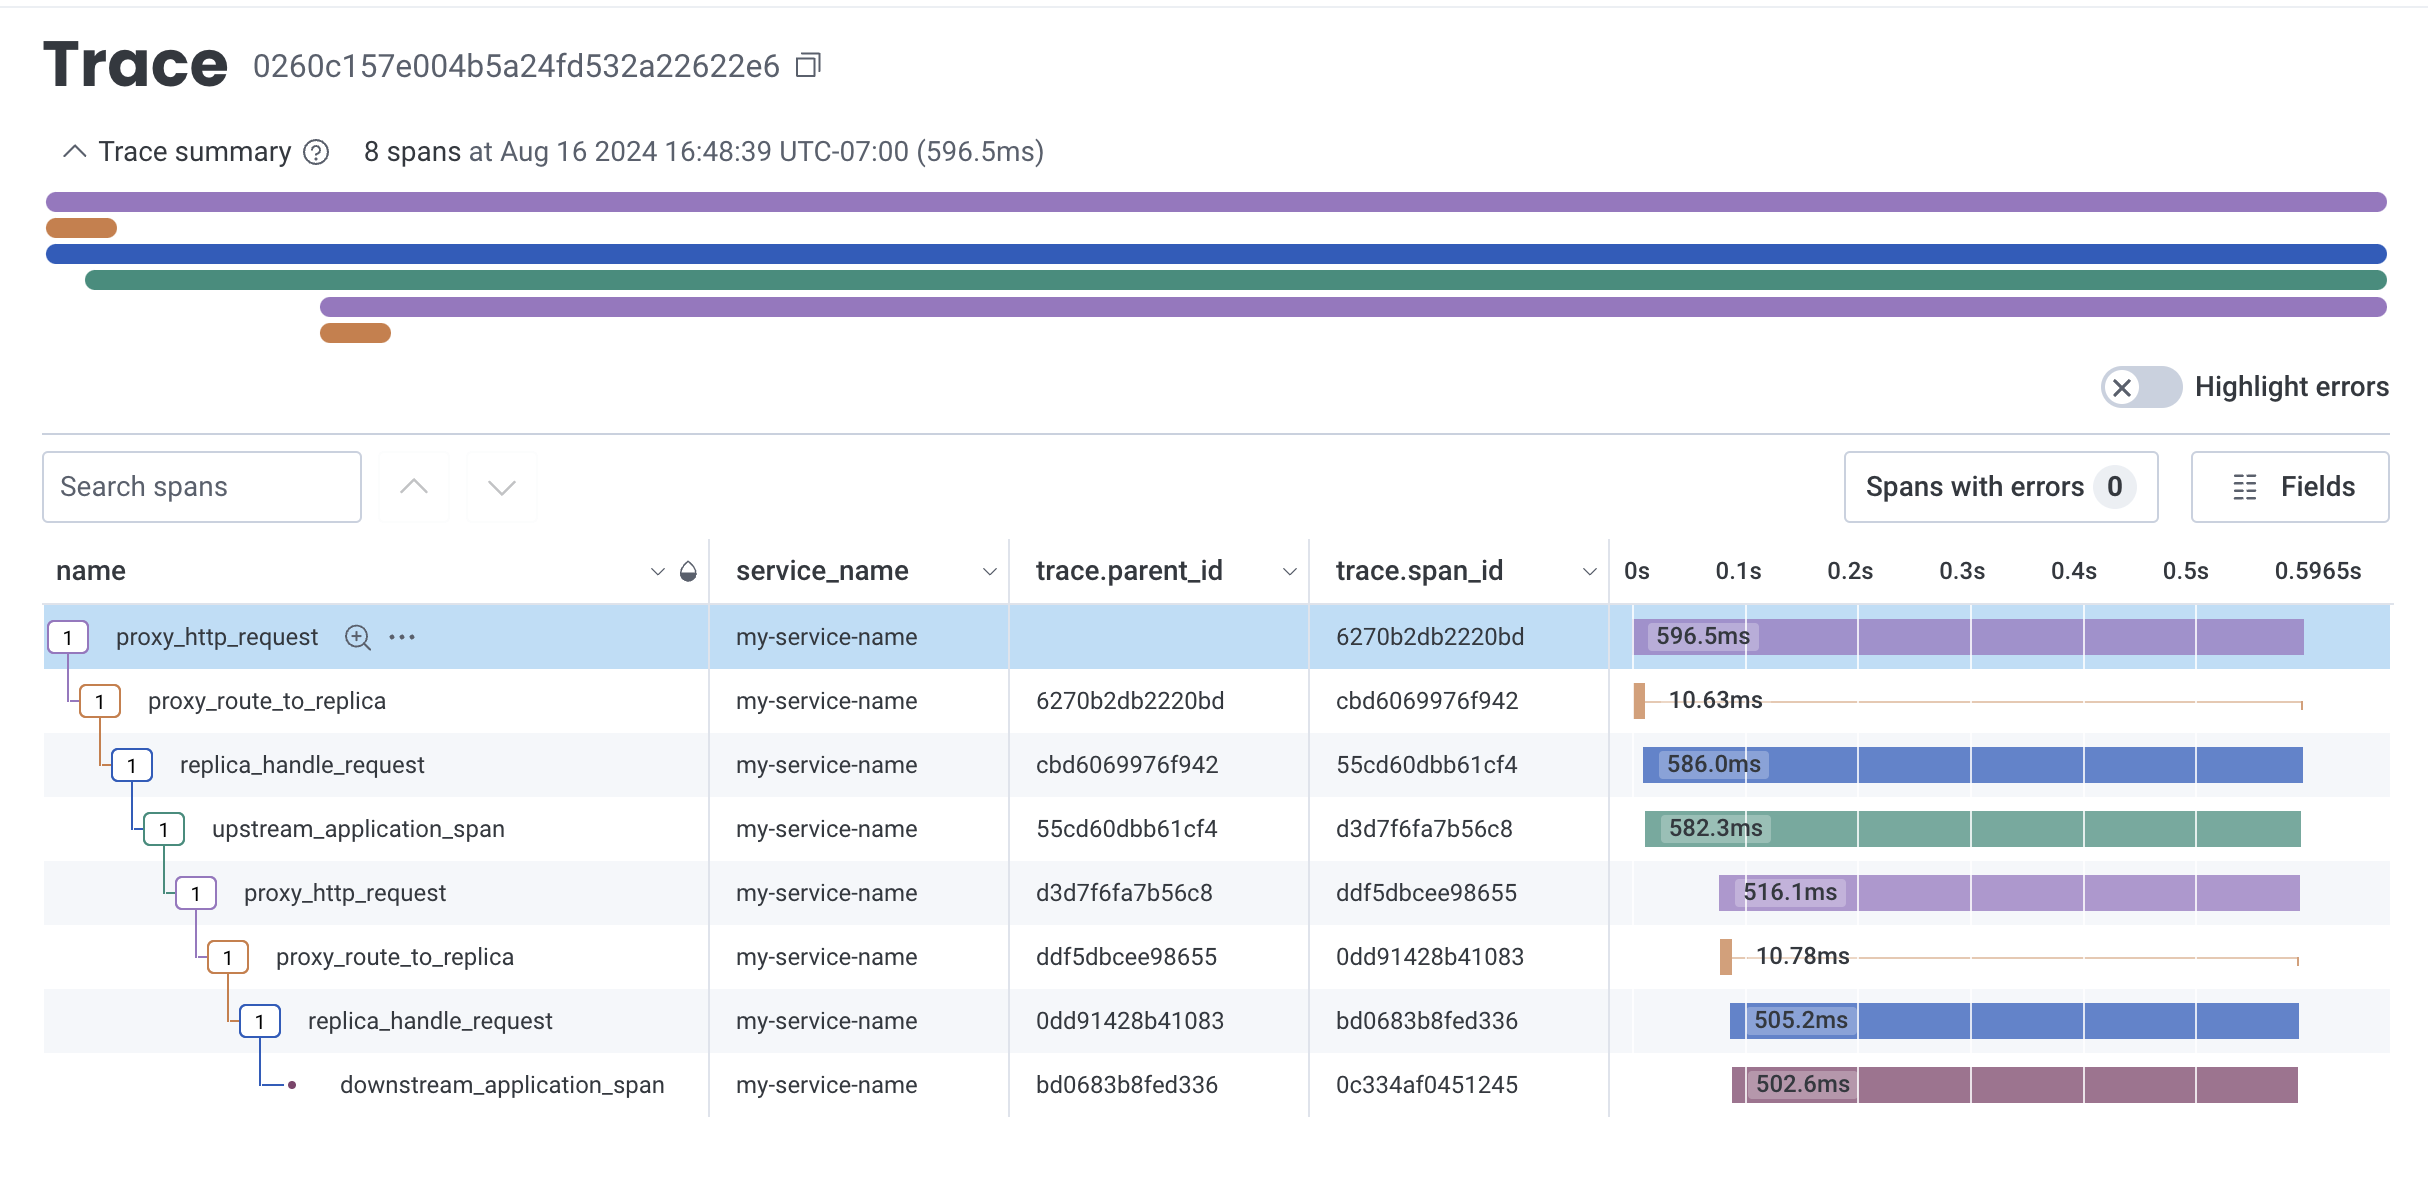
After querying your application, Anyscale exports traces to Honeycomb. The spans are linked properly between the upstream and downstream services.
Developing on workspaces
To enable tracing on workspaces, set the environment variable ANYSCALE_TRACING_EXPORTER_IMPORT_PATH to a valid exporter function. Define this environment variable after the workspace starts.
Start a workspace with the image of your choice, for example, anyscale/ray:2.55.1-slim-py312-cu123. Then, go to the Dependencies tab and add ANYSCALE_TRACING_EXPORTER_IMPORT_PATH=exporter_dev:debug_span_processor to the Environment Variables section. You need to terminate and restart the workspace for this environment variable to take effect.
Once the workspace restarts, define the exporter function in a exporter_dev.py file like below. The workspace uses this exporter function to export traces to the console for quick visualization of the attributes on the traces.
# exporter_dev.py
from opentelemetry.sdk.trace.export import ConsoleSpanExporter, SimpleSpanProcessor
from opentelemetry.sdk.trace import SpanProcessor
from typing import List


def debug_span_processor() -> List[SpanProcessor]:
    return [SimpleSpanProcessor(ConsoleSpanExporter())]
Use the same default_serve_hello.py file from the previous section.
Start the app with the following command:
serve run default_serve_hello:app
Open another terminal and run the following command to query the app:
curl http://localhost:8000/
The logs appear in the console as well as the logs tab with the tracing info.
(ProxyActor pid=4582) {
(ProxyActor pid=4582)     "name": "proxy_route_to_replica",
(ProxyActor pid=4582)     "context": {
(ProxyActor pid=4582)         "trace_id": "0xae8105e31de8043bbdd154239ed19890",
(ProxyActor pid=4582)         "span_id": "0x5e3ce2180a9ebaa5",
(ProxyActor pid=4582)         "trace_state": "[]"
(ProxyActor pid=4582)     },
(ProxyActor pid=4582)     "kind": "SpanKind.SERVER",
(ProxyActor pid=4582)     "parent_id": "55402d1e170cfc99",
(ProxyActor pid=4582)     "start_time": "2024-12-31T01:22:15.872177Z",
(ProxyActor pid=4582)     "end_time": "2024-12-31T01:22:15.882526Z",
(ProxyActor pid=4582)     "status": {
(ProxyActor pid=4582)         "status_code": "OK"
(ProxyActor pid=4582)     },
(ProxyActor pid=4582)     "attributes": {
(ProxyActor pid=4582)         "request_id": "733674e0-298f-41e2-950d-32f82aa1cd55",
(ProxyActor pid=4582)         "deployment": "HelloWorld",
(ProxyActor pid=4582)         "app": "default",
(ProxyActor pid=4582)         "call_method": "__call__",
(ProxyActor pid=4582)         "route": "/",
(ProxyActor pid=4582)         "multiplexed_model_id": "",
(ProxyActor pid=4582)         "is_streaming": true,
(ProxyActor pid=4582)         "is_http_request": true,
(ProxyActor pid=4582)         "is_grpc_request": false
(ProxyActor pid=4582)     },
(ProxyActor pid=4582)     "events": [],
(ProxyActor pid=4582)     "links": [],
(ProxyActor pid=4582)     "resource": {
(ProxyActor pid=4582)         "telemetry.sdk.language": "python",
(ProxyActor pid=4582)         "telemetry.sdk.name": "opentelemetry",
(ProxyActor pid=4582)         "telemetry.sdk.version": "1.1.0",
(ProxyActor pid=4582)         "service.name": "unknown_service"
(ProxyActor pid=4582)     }
(ProxyActor pid=4582) }
(ProxyActor pid=4582) {
(ProxyActor pid=4582)     "name": "proxy_http_request",
(ProxyActor pid=4582)     "context": {
(ProxyActor pid=4582)         "trace_id": "0xae8105e31de8043bbdd154239ed19890",
(ProxyActor pid=4582)         "span_id": "0x55402d1e170cfc99",
(ProxyActor pid=4582)         "trace_state": "[]"
(ProxyActor pid=4582)     },
(ProxyActor pid=4582)     "kind": "SpanKind.SERVER",
(ProxyActor pid=4582)     "parent_id": null,
(ProxyActor pid=4582)     "start_time": "2024-12-31T01:22:15.871729Z",
(ProxyActor pid=4582)     "end_time": "2024-12-31T01:22:15.891219Z",
(ProxyActor pid=4582)     "status": {
(ProxyActor pid=4582)         "status_code": "OK"
(ProxyActor pid=4582)     },
(ProxyActor pid=4582)     "attributes": {
(ProxyActor pid=4582)         "request_id": "733674e0-298f-41e2-950d-32f82aa1cd55",
(ProxyActor pid=4582)         "deployment": "HelloWorld",
(ProxyActor pid=4582)         "app": "default",
(ProxyActor pid=4582)         "request_type": "http",
(ProxyActor pid=4582)         "request_method": "GET",
(ProxyActor pid=4582)         "request_route_path": "/"
(ProxyActor pid=4582)     },
(ProxyActor pid=4582)     "events": [],
(ProxyActor pid=4582)     "links": [],
(ProxyActor pid=4582)     "resource": {
(ProxyActor pid=4582)         "telemetry.sdk.language": "python",
(ProxyActor pid=4582)         "telemetry.sdk.name": "opentelemetry",
(ProxyActor pid=4582)         "telemetry.sdk.version": "1.1.0",
(ProxyActor pid=4582)         "service.name": "unknown_service"
(ProxyActor pid=4582)     }
(ProxyActor pid=4582) }
(ServeReplica:default:HelloWorld pid=4712)     "name": "replica_handle_request",
(ServeReplica:default:HelloWorld pid=4712)         "replica_id": "3npxyudx",
(ServeReplica:default:HelloWorld pid=4712)         "is_streaming": true
(ServeReplica:default:HelloWorld pid=4712) INFO 2024-12-31 01:22:15,889 default_HelloWorld 3npxyudx 733674e0-298f-41e2-950d-32f82aa1cd55 -- GET / 200 8.1ms
Export traces to Datadog
You can use Datadog agent to export traces to their platform. This doc doesn't cover how to set up Datadog agents. See Datadog Agent for more information. The idea is to have dd agent running as a sidecar on the same instance as the Ray Serve app and have the exporter function export the traces to the ports which the Datadog agent is listening on.
The following are tips to get you started:
Shell script to start a local Datadog agent
#!/bin/bash

set -x

export DD_API_KEY=TOTALLY_FAKE_API_KEY
export DD_SITE=datadoghq.com
docker run --rm -d --cgroupns host --pid host --name dd-agent \
    -p 8126:8126 \
    -p 4318:4318 \
    -v /var/run/docker.sock:/var/run/docker.sock:ro \
    -v /proc/:/host/proc/:ro \
    -v /sys/fs/cgroup/:/host/sys/fs/cgroup:ro \
    -e DD_SITE=${DD_SITE} \
    -e DD_API_KEY=${DD_API_KEY} \
    -e DD_OTLP_CONFIG_RECEIVER_PROTOCOLS_HTTP_ENDPOINT=0.0.0.0:4318 \
    gcr.io/datadoghq/agent:7
Useful environment variables to set in the Docker image
OTEL_EXPORTER_OTLP_ENDPOINT=http://0.0.0.0:4318
OTEL_LOG_LEVEL=DEBUG
OTEL_SERVICE_NAME=my-service-name
ANYSCALE_TRACING_EXPORTER_IMPORT_PATH=exporter_dd:anyscale_span_processors
Exporter function to export traces to Datadog agent
import ray

from opentelemetry.context import Context
from opentelemetry.exporter.otlp.proto.http.trace_exporter import OTLPSpanExporter
from opentelemetry.sdk.trace import Span, SpanProcessor
from opentelemetry.sdk.trace.export import BatchSpanProcessor


def _add_ray_serve_context(span: Span) -> None:
    """Add Ray Serve context metadata into Datadog span."""
    # Add Ray Serve context.
    ray_context = ray.get_runtime_context()
    span.set_attribute("ray.job_id", ray_context.get_job_id())
    span.set_attribute("ray.actor_id", ray_context.get_actor_id())
    span.set_attribute("ray.task_id", ray_context.get_task_id())

    # Add request ID.
    serve_request_context = ray.serve.context._get_serve_request_context()
    span.set_attribute("ray.request_id", serve_request_context.request_id)


class RayServeSpanProcessor(SpanProcessor):
    """Custom OTEL SpanProcessor that injects Ray context."""
    def on_start(self, span: Span, parent_context: Context | None = None) -> None:
        """Start span event hook.

        Inject Ray Serve context information.
        """
        _add_ray_serve_context(span)
        return super().on_start(span, parent_context)


def datadog_span_processor() -> SpanProcessor:
    """Return OTEL OTLP SpanExporter for integration with Datadog.

    To enable span export to Datadog over HTTP,
        1. Install the following dependencies:

            opentelemetry-exporter-otlp
            opentelemetry-exporter-otlp-proto-http

        2. Set the environment variable:

            OTEL_EXPORTER_OTLP_ENDPOINT=http://[datadog host]:4318
    """
    return BatchSpanProcessor(OTLPSpanExporter())


def anyscale_span_processors() -> list[SpanProcessor]:
    """Add span processors to instrumentation for use by Anyscale.

    Automagically, Anyscale adds span processors to the default TracerProvider during
    tracing initialization. In particular, the value of the envvar:

        ANYSCALE_TRACING_EXPORTER_IMPORT_PATH=exporter_dd:anyscale_span_processors

    should be an importable function, which returns a list of span processors.
    """
    return [
        RayServeSpanProcessor(),
        datadog_span_processor(),
    ]