Metrics
Metrics
Anyscale and Ray provides built-in metrics for monitoring your Ray clusters and the workloads you run on them. This page describes the metrics available and how to access them.
New metrics dashboard experience in Ray 2.50.0 or later
Anyscale has refreshed the performance and organization of Ray metrics dashboards in the Anyscale console.
All workloads running on Ray 2.50.0 or later use this enhanced experience for displaying Ray metrics, which includes a tabbed experience for metrics dashboards. The organization and ordering of some dashboards has changed to better reflect divisions between Ray Core and the other Ray libraries.
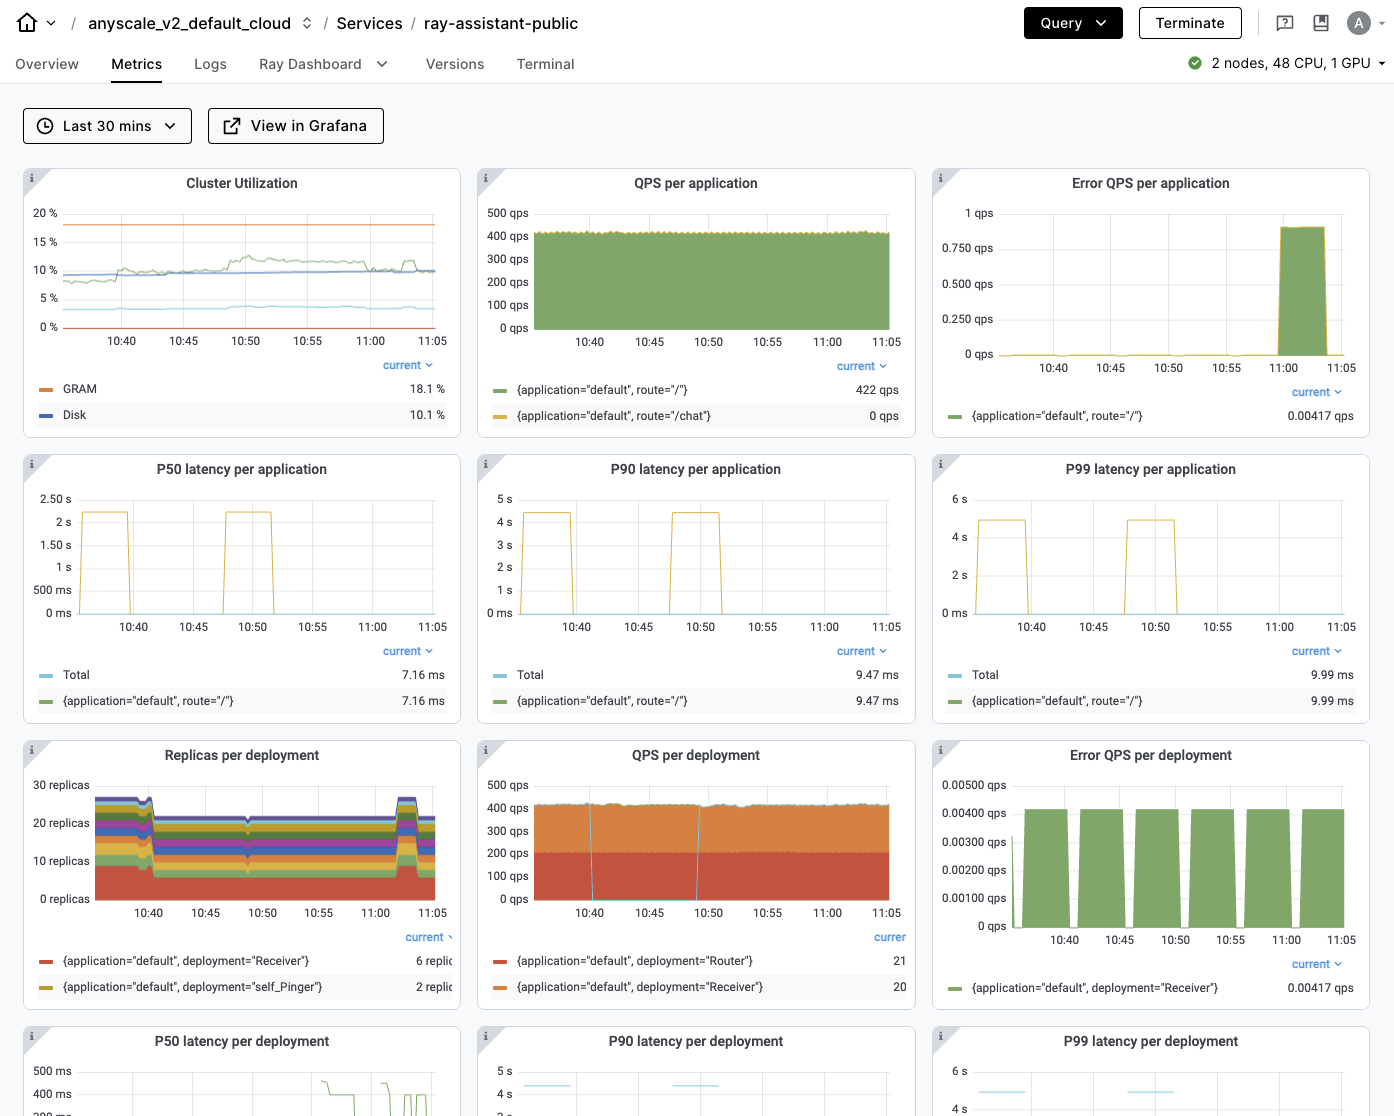
For all workloads, access metrics by navigating to the console page for your named workload. Click the Metrics tab. Ray Core metrics display by default.
The following table shows metrics tabs available for each workload type:
| Workload | Metrics tabs |
|---|---|
| Workspace |
|
| Job |
|
| Service |
|
Available metrics
Ray metrics
Ray comes with a set of built-in metrics. You can view the full list of metrics in the System Metrics Ray documentation
Anyscale metrics
Anyscale adds additional metrics for your Ray application depending on the workload. For services, service-level metrics provide information on service health, request latency, and request throughput. For more information, see Monitoring a service.
For all metrics exported by Ray and Anyscale, Anyscale adds additional labels to each metric to help you filter and aggregate them. The labels include:
ClusterId: The ID of the Ray cluster where the metric is emitted.ServiceId: The ID of the service where the metric is emitted if the cluster is part of an Anyscale service.ServiceName: The name of the service where the metric is emitted if the cluster is part of an Anyscale service.ServiceVersionId: The ID of the service version where the metric is emitted if the cluster is part of a Anyscale service.AnyscaleJobId(alias ofProdJobId): The ID of the job where the metric is emitted if the cluster is part of an Anyscale Job.JobName(alias ofProdJobName): The name of the job where the metric is emitted if the cluster is part of an Anyscale Job.NodeId: The ID of the node where the metric is emitted.NodeIp: The IP address of the node where the metric is emitted.OrgName: The name of the organization where the metric is emitted.CloudId: The ID of the cloud where the metric is emitted.IsAnyscaleHosted: A boolean indicating whether the metric is emitted from an Anyscale-hosted cloud.
Custom application metrics
As a developer, you can add custom metrics to your applications. This is useful if you want to track the behavior of your application over time. You can use the ray.metrics module to add custom metrics to your application. For more information, see the Adding Application-Level Metrics Ray documentation
Accessing metrics
Anyscale UI
In the workspaces, jobs, and services pages there are tabs to view metrics.

Grafana
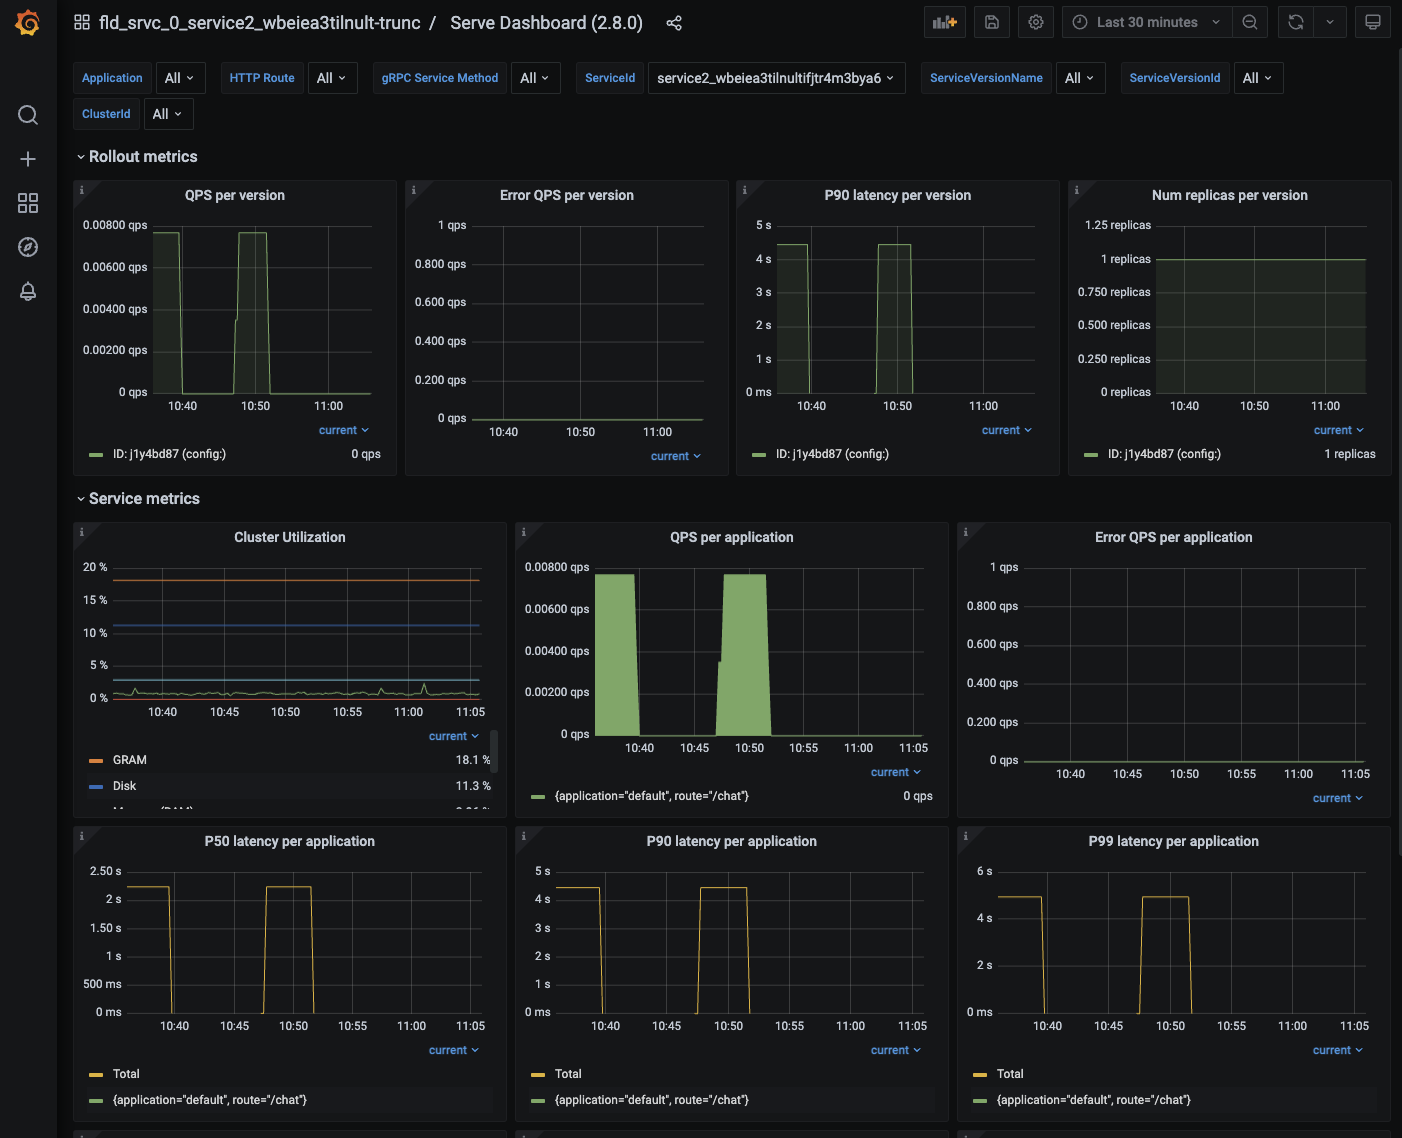
You can access the metrics in Grafana by clicking on the "View in Grafana" button in the metrics page. Using Grafana allows you to create custom dashboards and explore the metrics using advanced queries, including filtering and aggregating by labels. See the Grafana documentation for more information.

Ray Dashboard
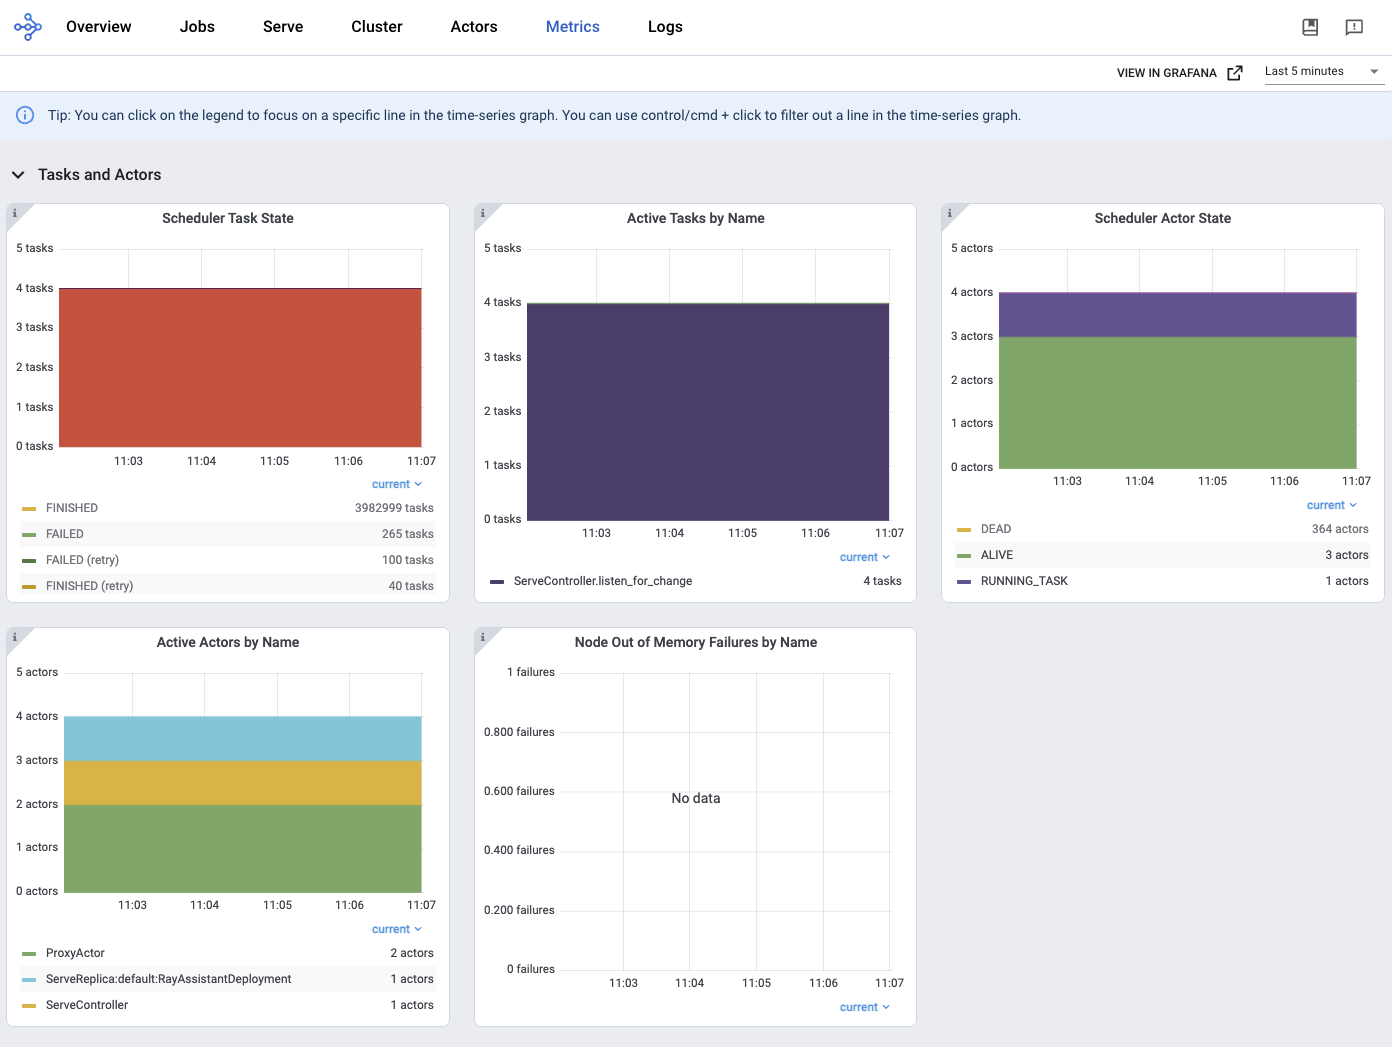
You can access all Ray system metrics in the Ray Dashboard by clicking on the Ray Dashboard tab. See the Ray Dashboard documentation for more information.

Custom application metrics
To access custom metrics, use the Grafana UI to explore your metrics or create custom dashboards. The Explore tab in the Grafana UI allows you to write queries to filter and aggregate your metrics. See the Grafana documentation for more information.
To learn more about creating custom dashboards, see Custom dashboards and alerting guide.
Metrics ingestion
Metrics are scraped from the head node every 15 seconds. Metrics are scraped from the worker nodes every 60 seconds.
Metrics retention
Anyscale retains metrics data for up to 90 days or up to 1,000,000 active series.