Debugging Ray OOM errors
Debugging Ray OOM errors
This document is part of a series of debugging tips for the most common Ray + Anyscale errors. It leverages Anyscale's observability suite to identify the root causes of issues. Each error has a real code example to demonstrate the debugging process. These steps are also applicable to other applications encountering similar errors.
This document specifically focuses on debugging Out of Memory (OOM) errors, which often manifest as a Killed error message.
Example
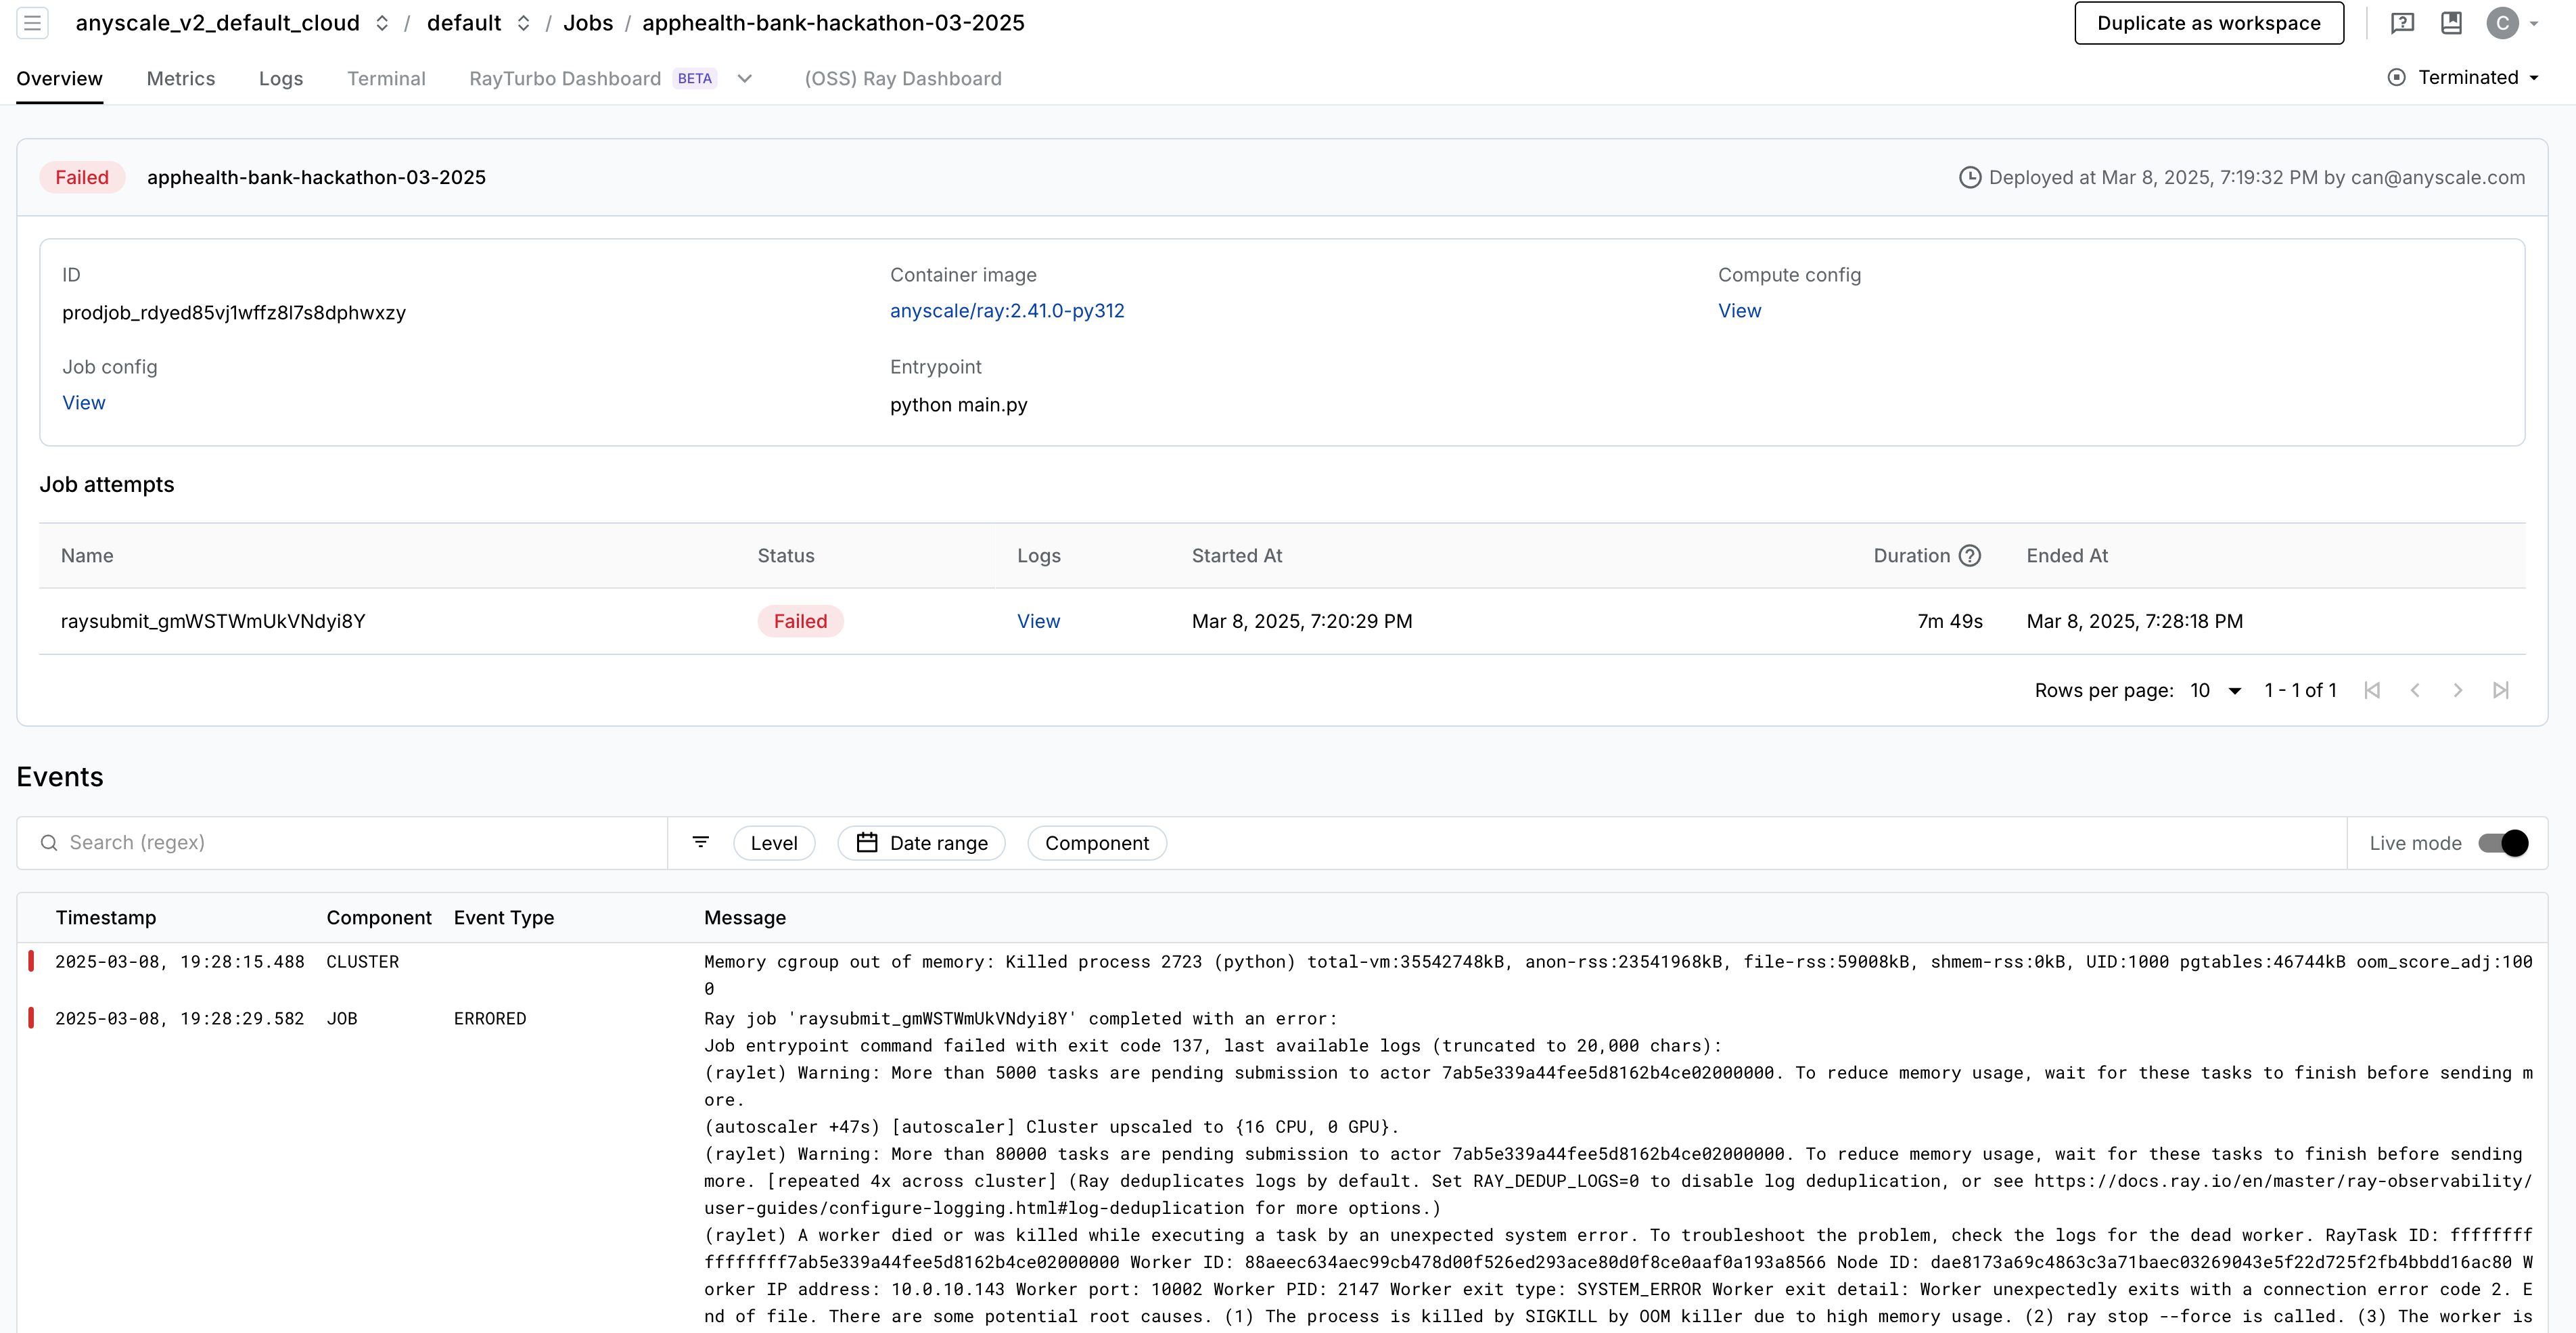
The job prodjob_rdyed85vj1wffz8l7s8dphwxzy failed on March 8, 2025, at 7:28:18 PM due to the following error:
(final_aggregation pid=2157, ip=10.0.6.32) :task_n
(final_aggregation pid=2157, ip=10.0.6.32) ame:final_aggregation
Killed
Step 1: Confirm OOM Errors
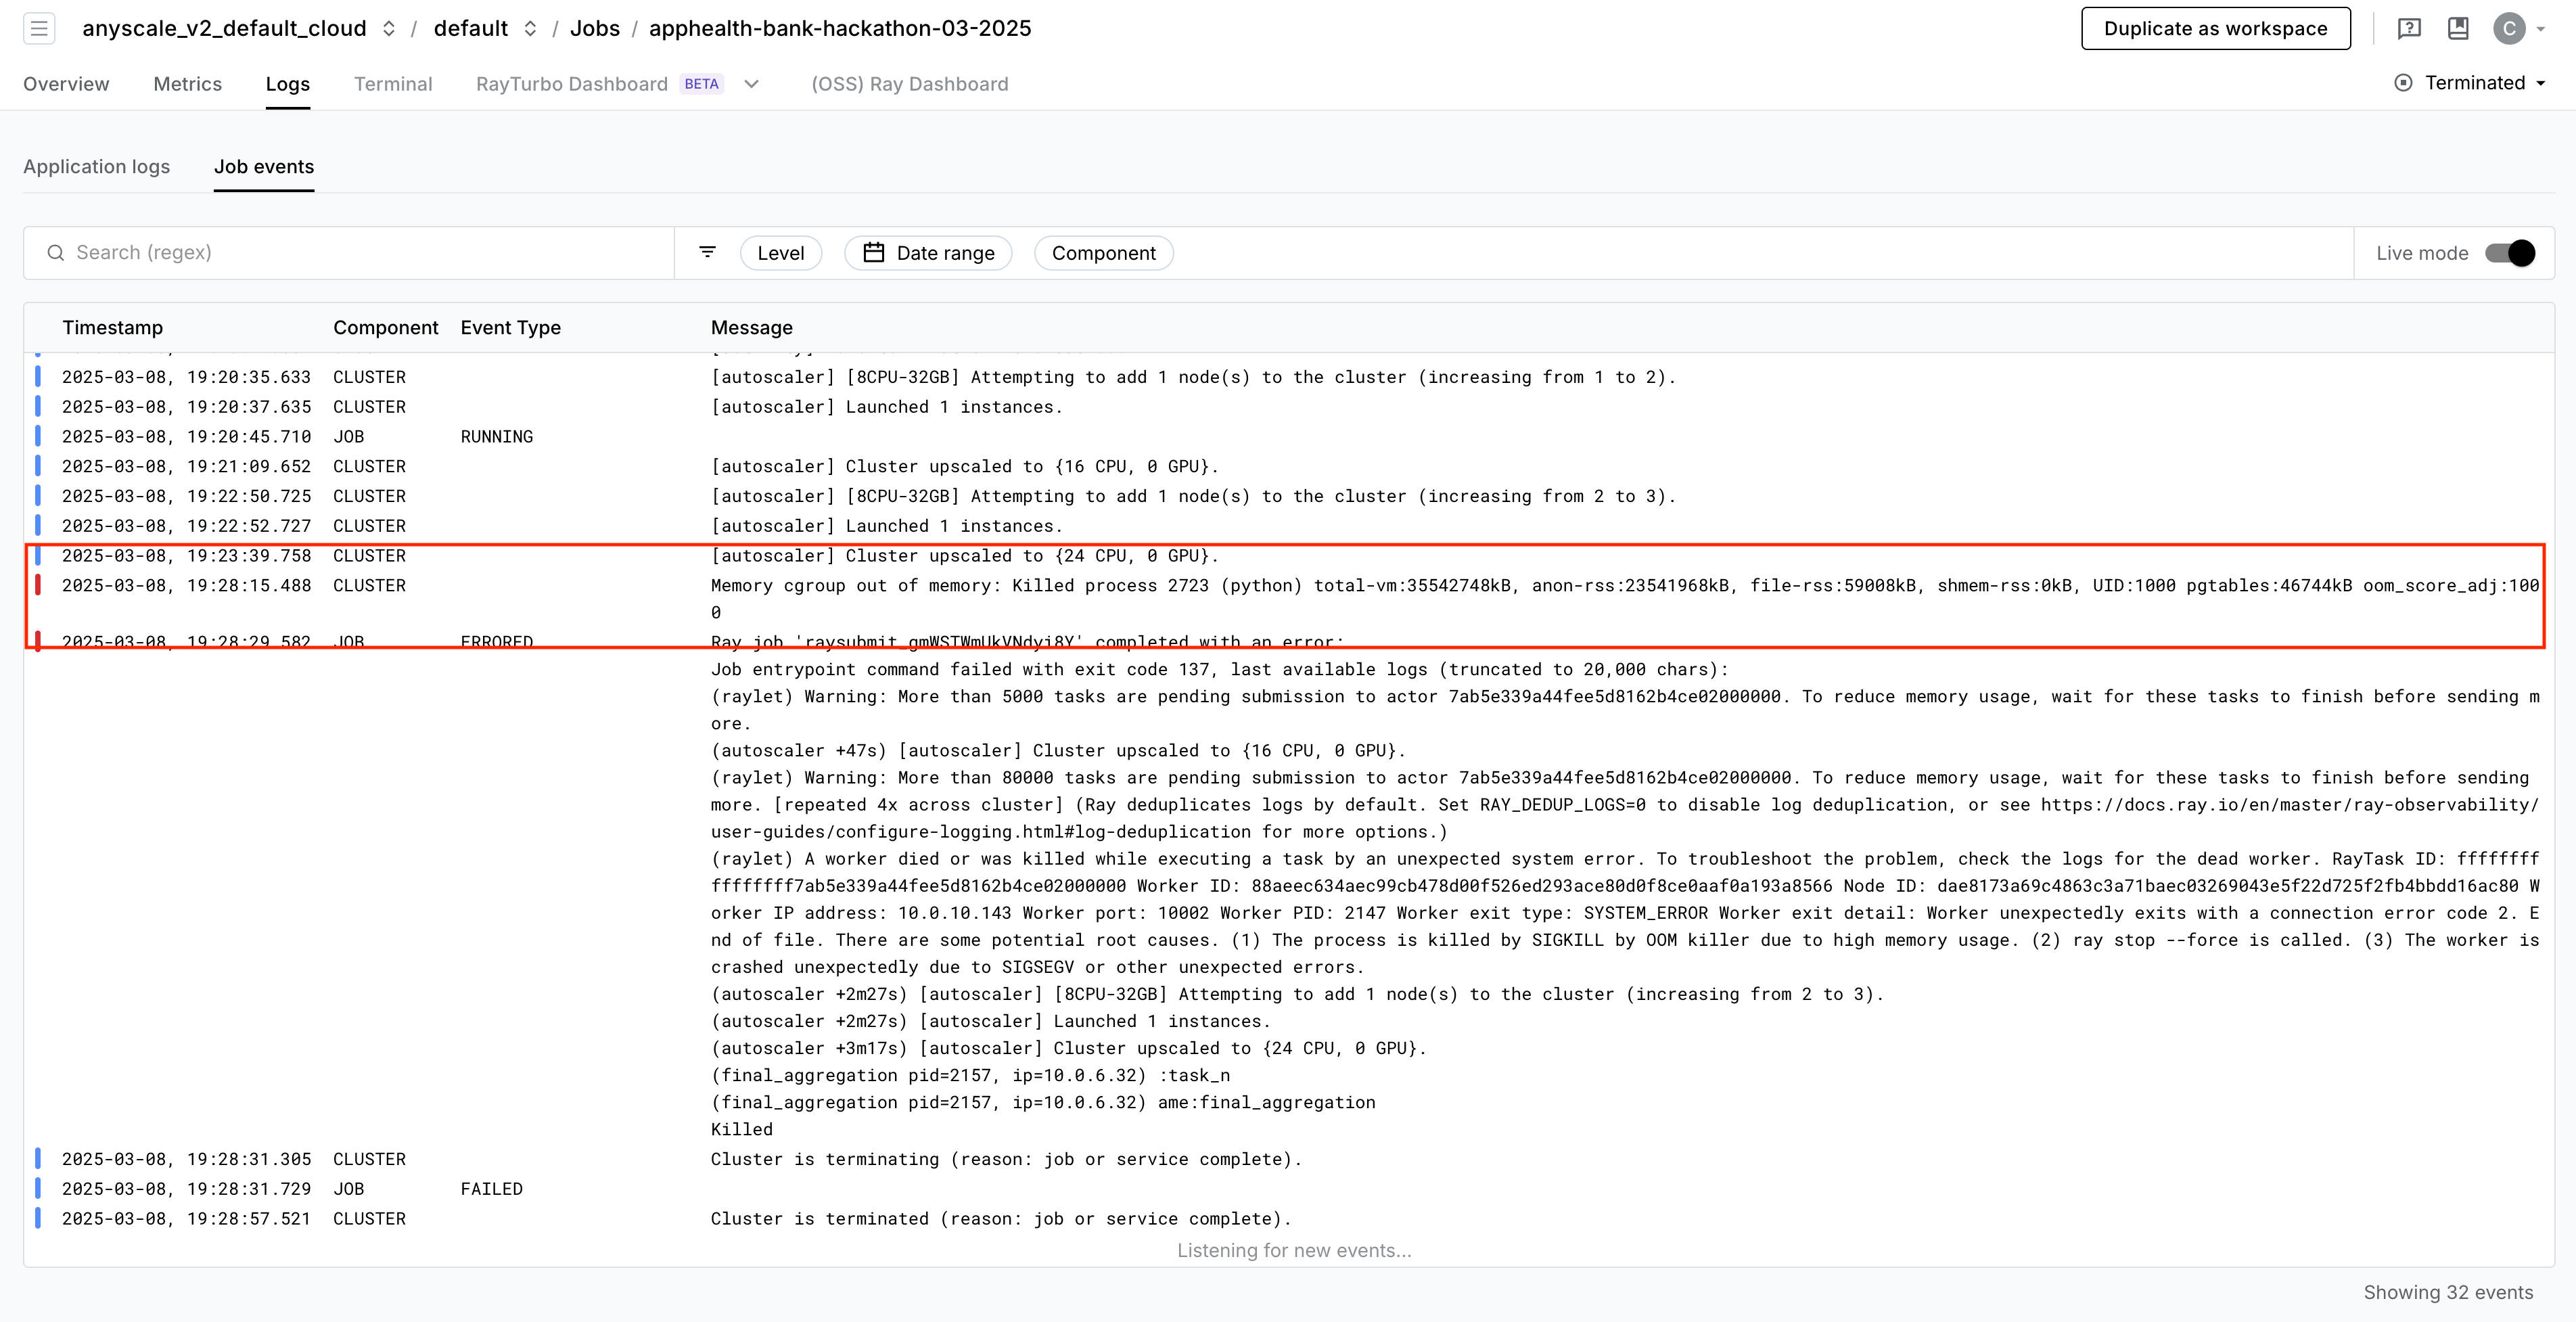
To confirm that this is a cluster-level Out-of-Memory (OOM) error, check for the presence of a cgroup log in the Anyscale cluster events. Although this log may not pinpoint the exact source of the error, it strongly suggests that the issue is due to an out-of-memory condition. Unlike the typical, sometimes transient Ray OOM killer warnings, this Linux-level error log provides a high level of confidence that the cluster experienced an OOM event.
Memory cgroup out of memory: Killed process 2723 (python) total-vm:35542748kB, anon-rss:23541968kB, file-rss:59008kB, shmem-rss:0kB, UID:1000 pgtables:46744kB oom_score_adj:1000
Step 2: Find the OOM Instance ID
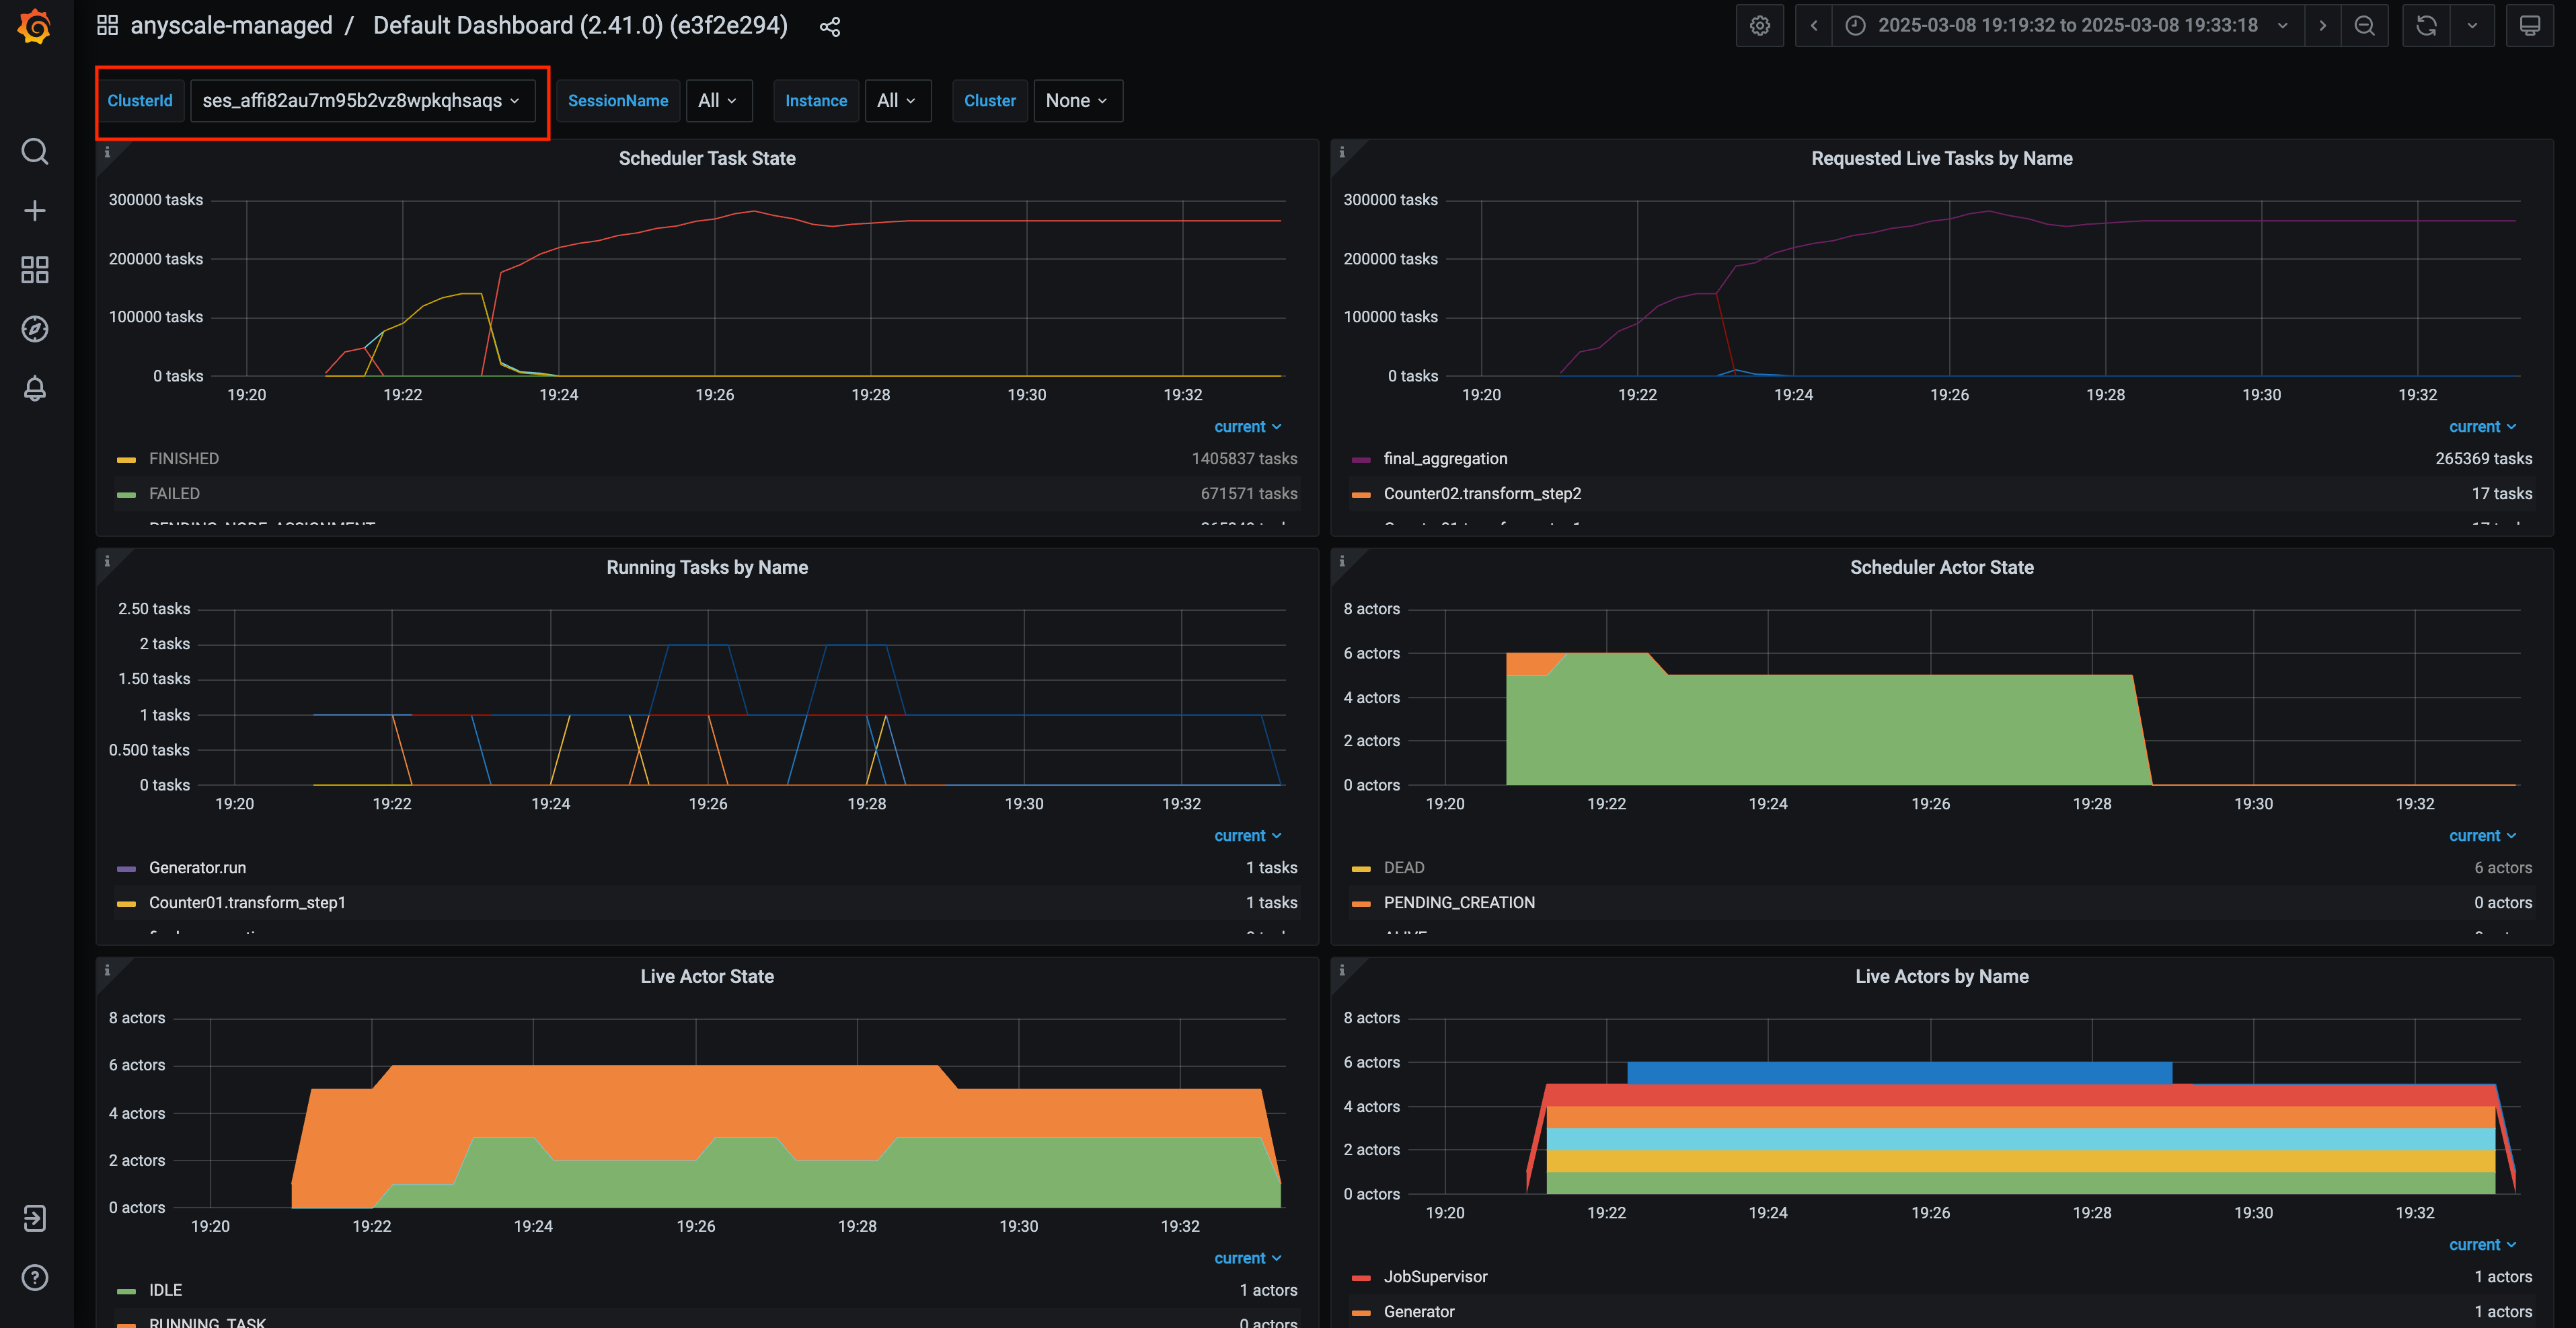
Access the Ray Core Grafana dashboard available on the Anyscale platform. Use a PromQL query to find the instance ID that had the highest memory usage around the error timestamp-March 8, 2025, at 7:28:18 PM. You can reuse the following query by updating the ClusterId field, which you can find in the Ray Core Grafana dashboard:
100 * sum(ray_node_mem_used{ClusterId="<YOUR_CLUSTER_ID>"}) by (NodeId) / sum(ray_node_mem_total{ClusterId="<YOUR_CLUSTER_ID>"}) by (NodeId)
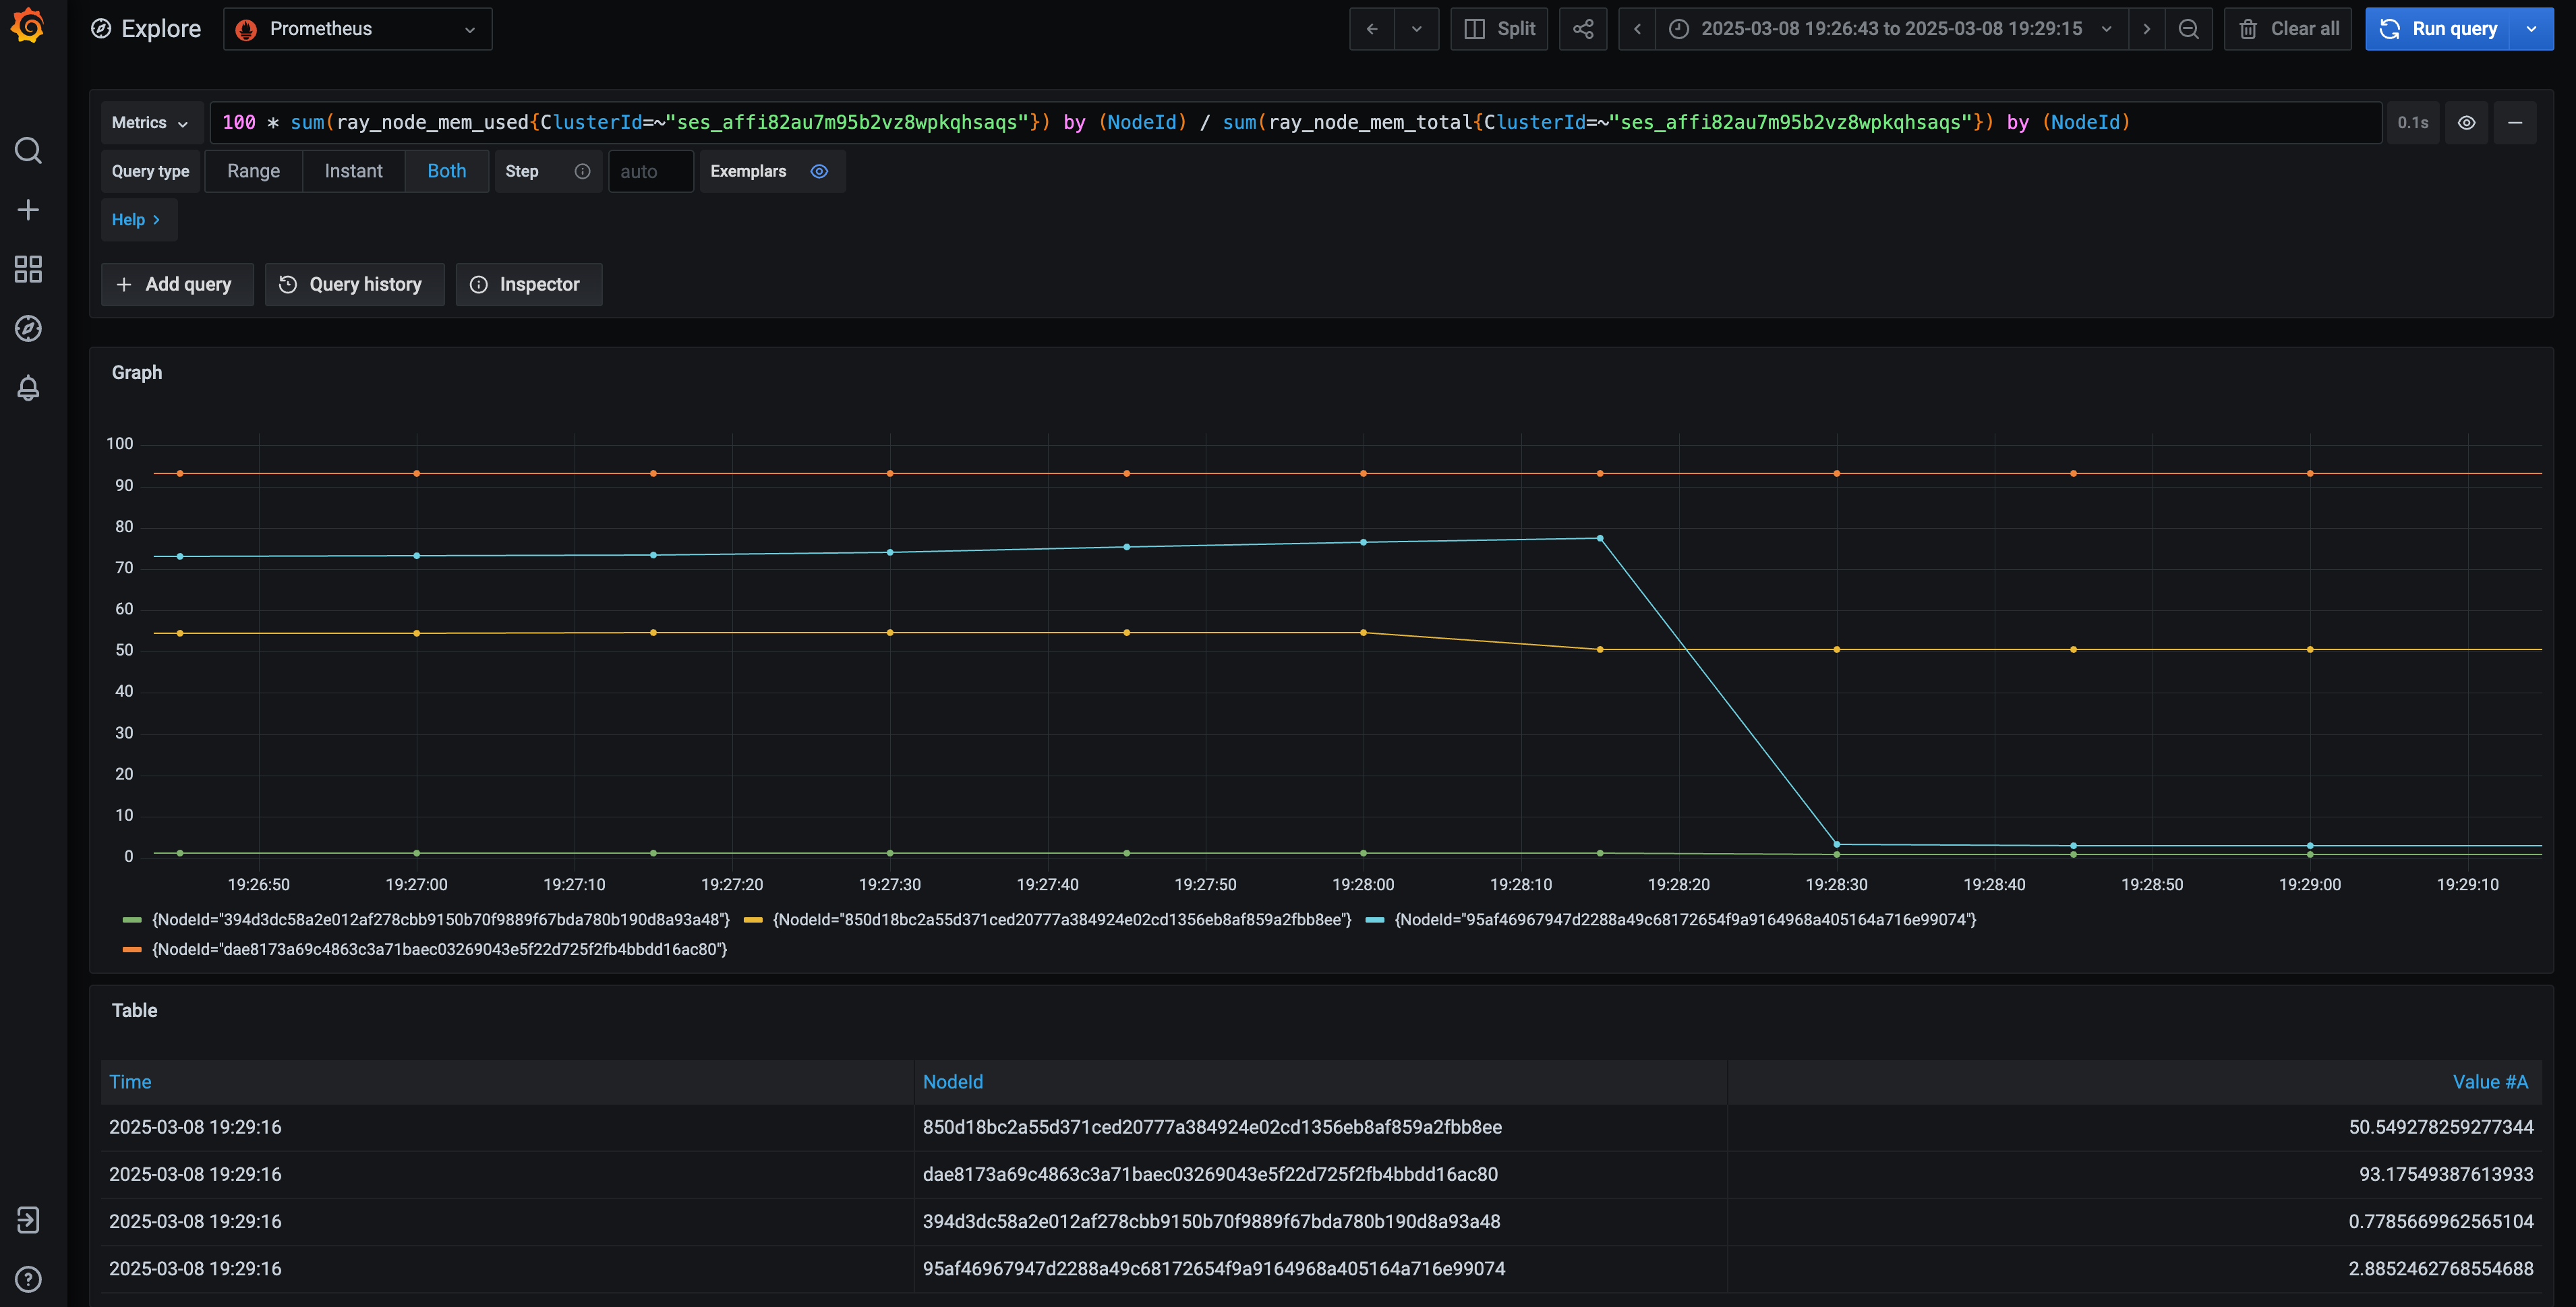
The node with the highest memory consumption has the ID dae8173a69c4863c3a71baec03269043e5f22d725f2fb4bbdd16ac80. Additionally, observe that the node with ID 95af46967947d2288a49c68172654f9a9164968a405164a716e99074 eventually shows a decline in the chart. Because this node is the head node, keep its ID in mind and examine it further.
Step 3: Find the OOM task
From the node ID identified in the previous step, find an OOM-related log associated with this node ID in the job log:
(raylet) A worker died or was killed while executing a task by an unexpected system error. To troubleshoot the problem,
check the logs for the dead worker. RayTask ID: ffffffffffffffff7ab5e339a44fee5d8162b4ce02000000
Worker ID: 88aeec634aec99cb478d00f526ed293ace80d0f8ce0aaf0a193a8566 Node ID: dae8173a69c4863c3a71baec03269043e5f22d725f2fb4bbdd16ac80
Worker IP address: 10.0.10.143 Worker port: 10002 Worker PID: 2147 Worker exit type: SYSTEM_ERROR Worker exit detail:
Worker unexpectedly exits with a connection error code 2. End of file. There are some potential root causes.
(1) The process is killed by SIGKILL by OOM killer due to high memory usage. (2) ray stop --force is called.
(3) The worker is crashed unexpectedly due to SIGSEGV or other unexpected errors.
This error message often indicates that Ray killed and retried a worker. However, based on the analysis so far, you can confidently conclude that this worker ultimately leads to the OOM condition of the entire cluster. The worker ID associated with the problem is 88aeec634aec99cb478d00f526ed293ace80d0f8ce0aaf0a193a8566.
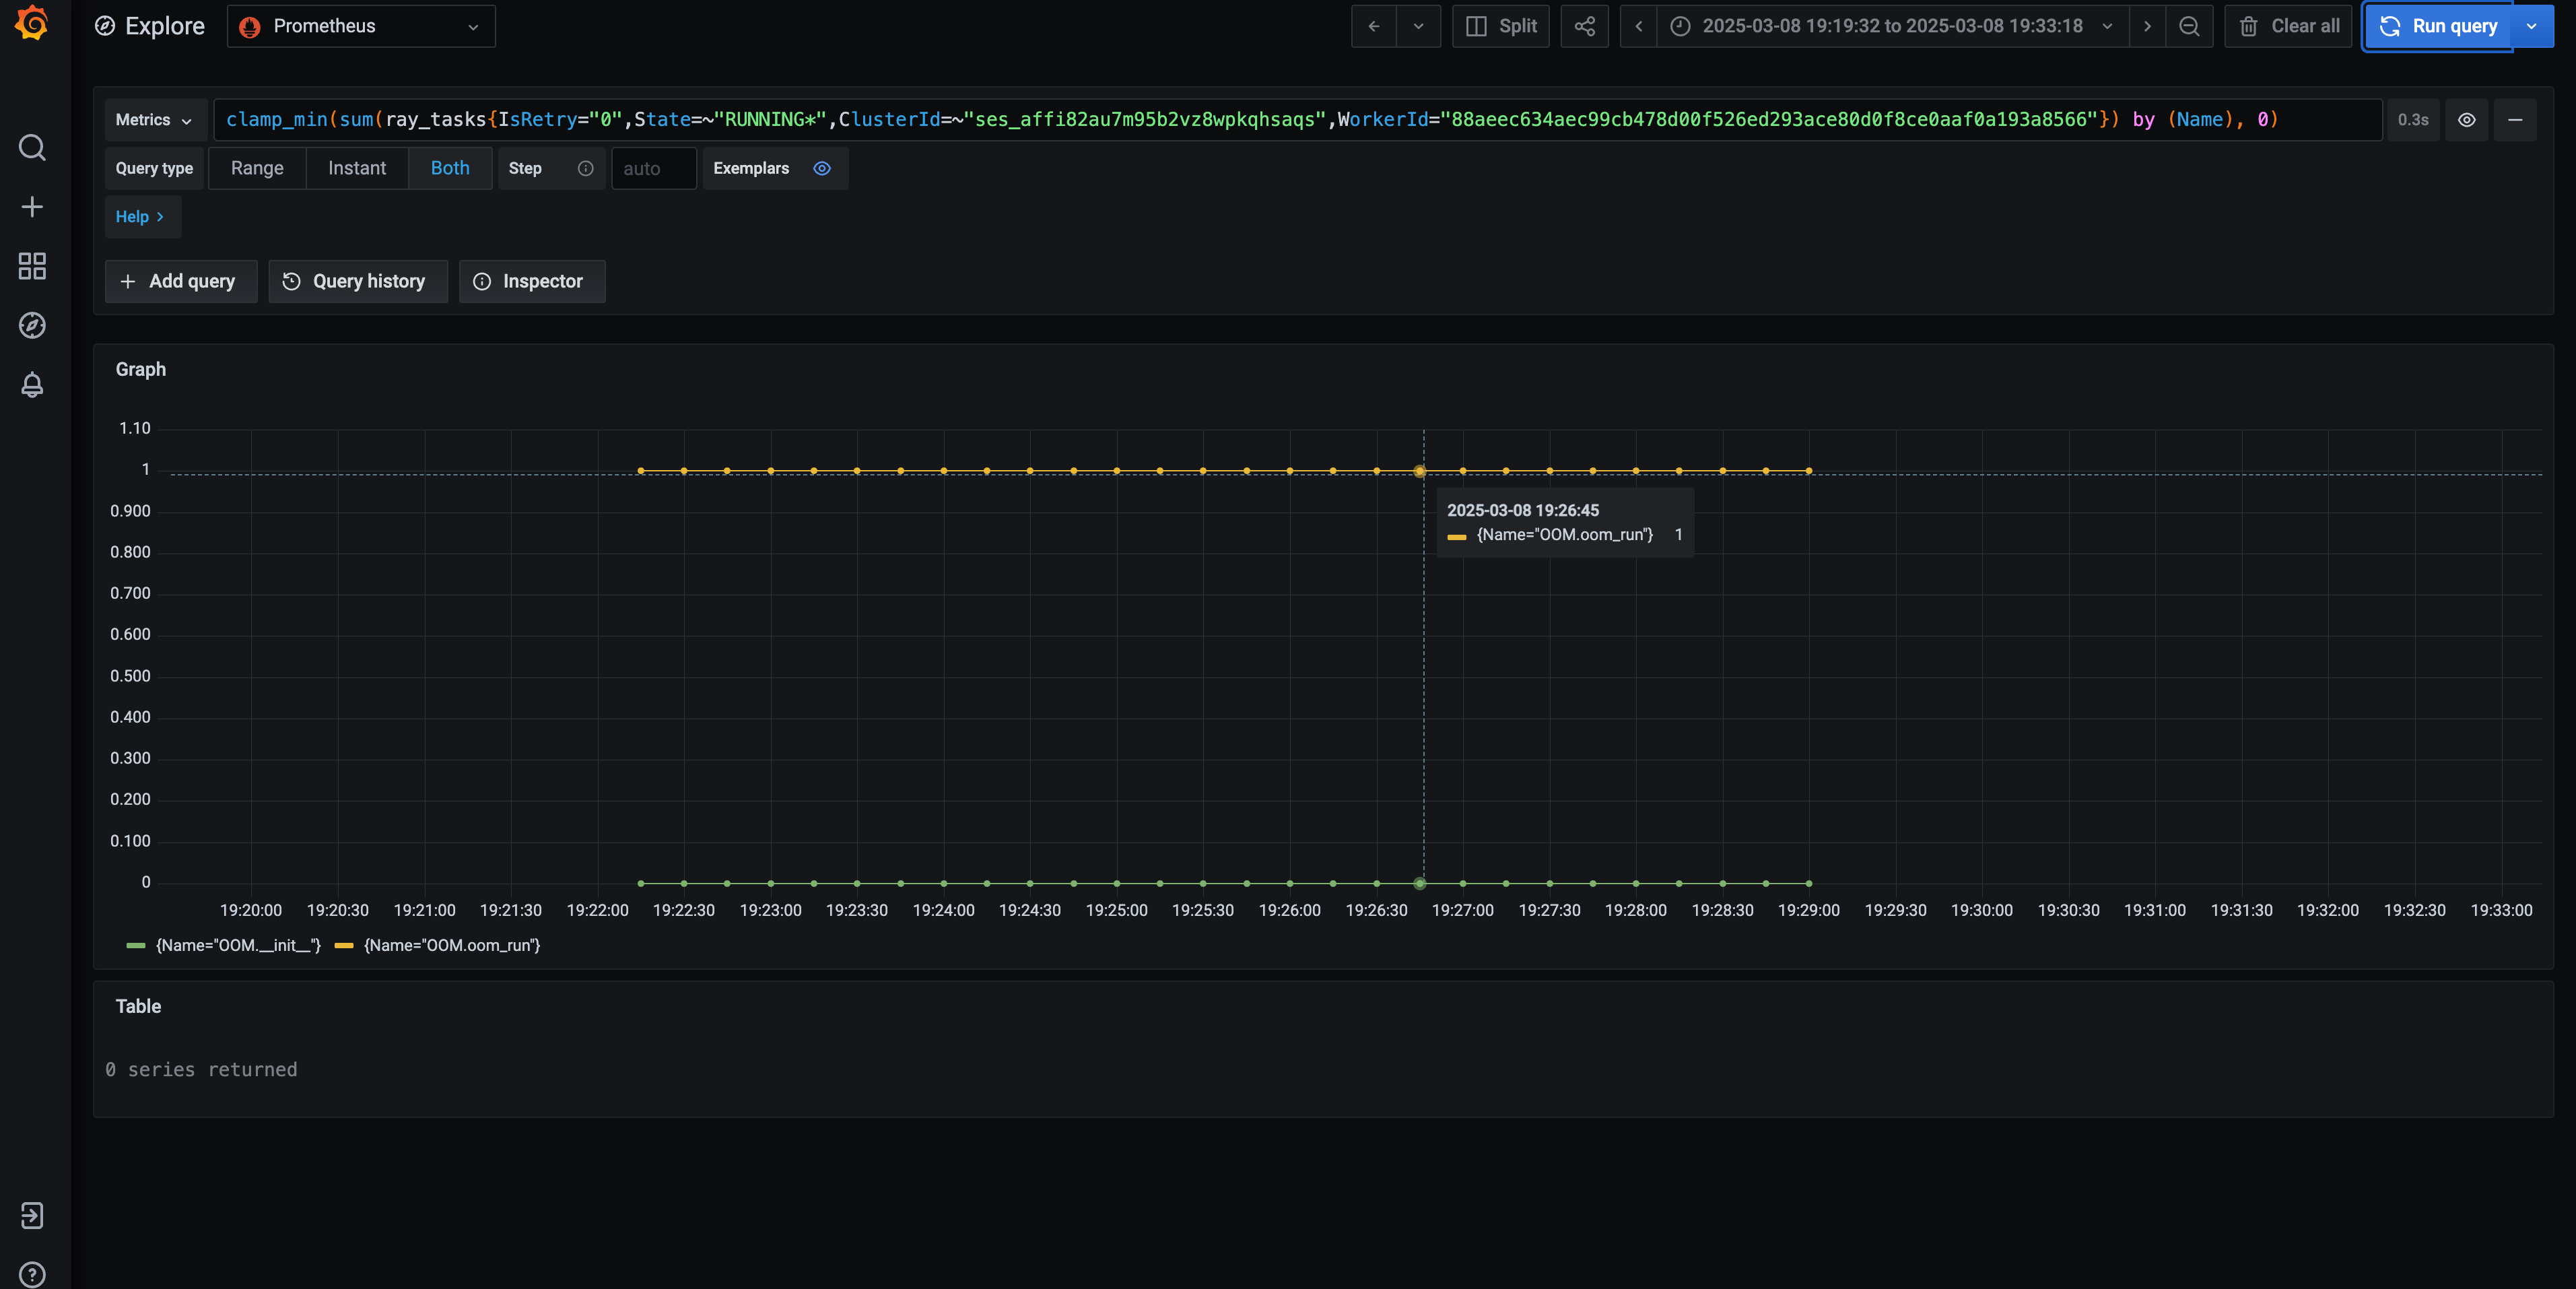
Again, using the Grafana dashboard provided on the Anyscale platform, you can construct a query to find the task name associated with this worker ID. In this case, the culprit is the OOM.oom_run task. The following is another PromQL that you can reuse for your case:
clamp_min(sum(ray_tasks{State="RUNNING", ClusterId="<YOUR_CLUSTER_ID>", WorkerId="<YOUR_WORKER_ID>"}) by (Name), 0)
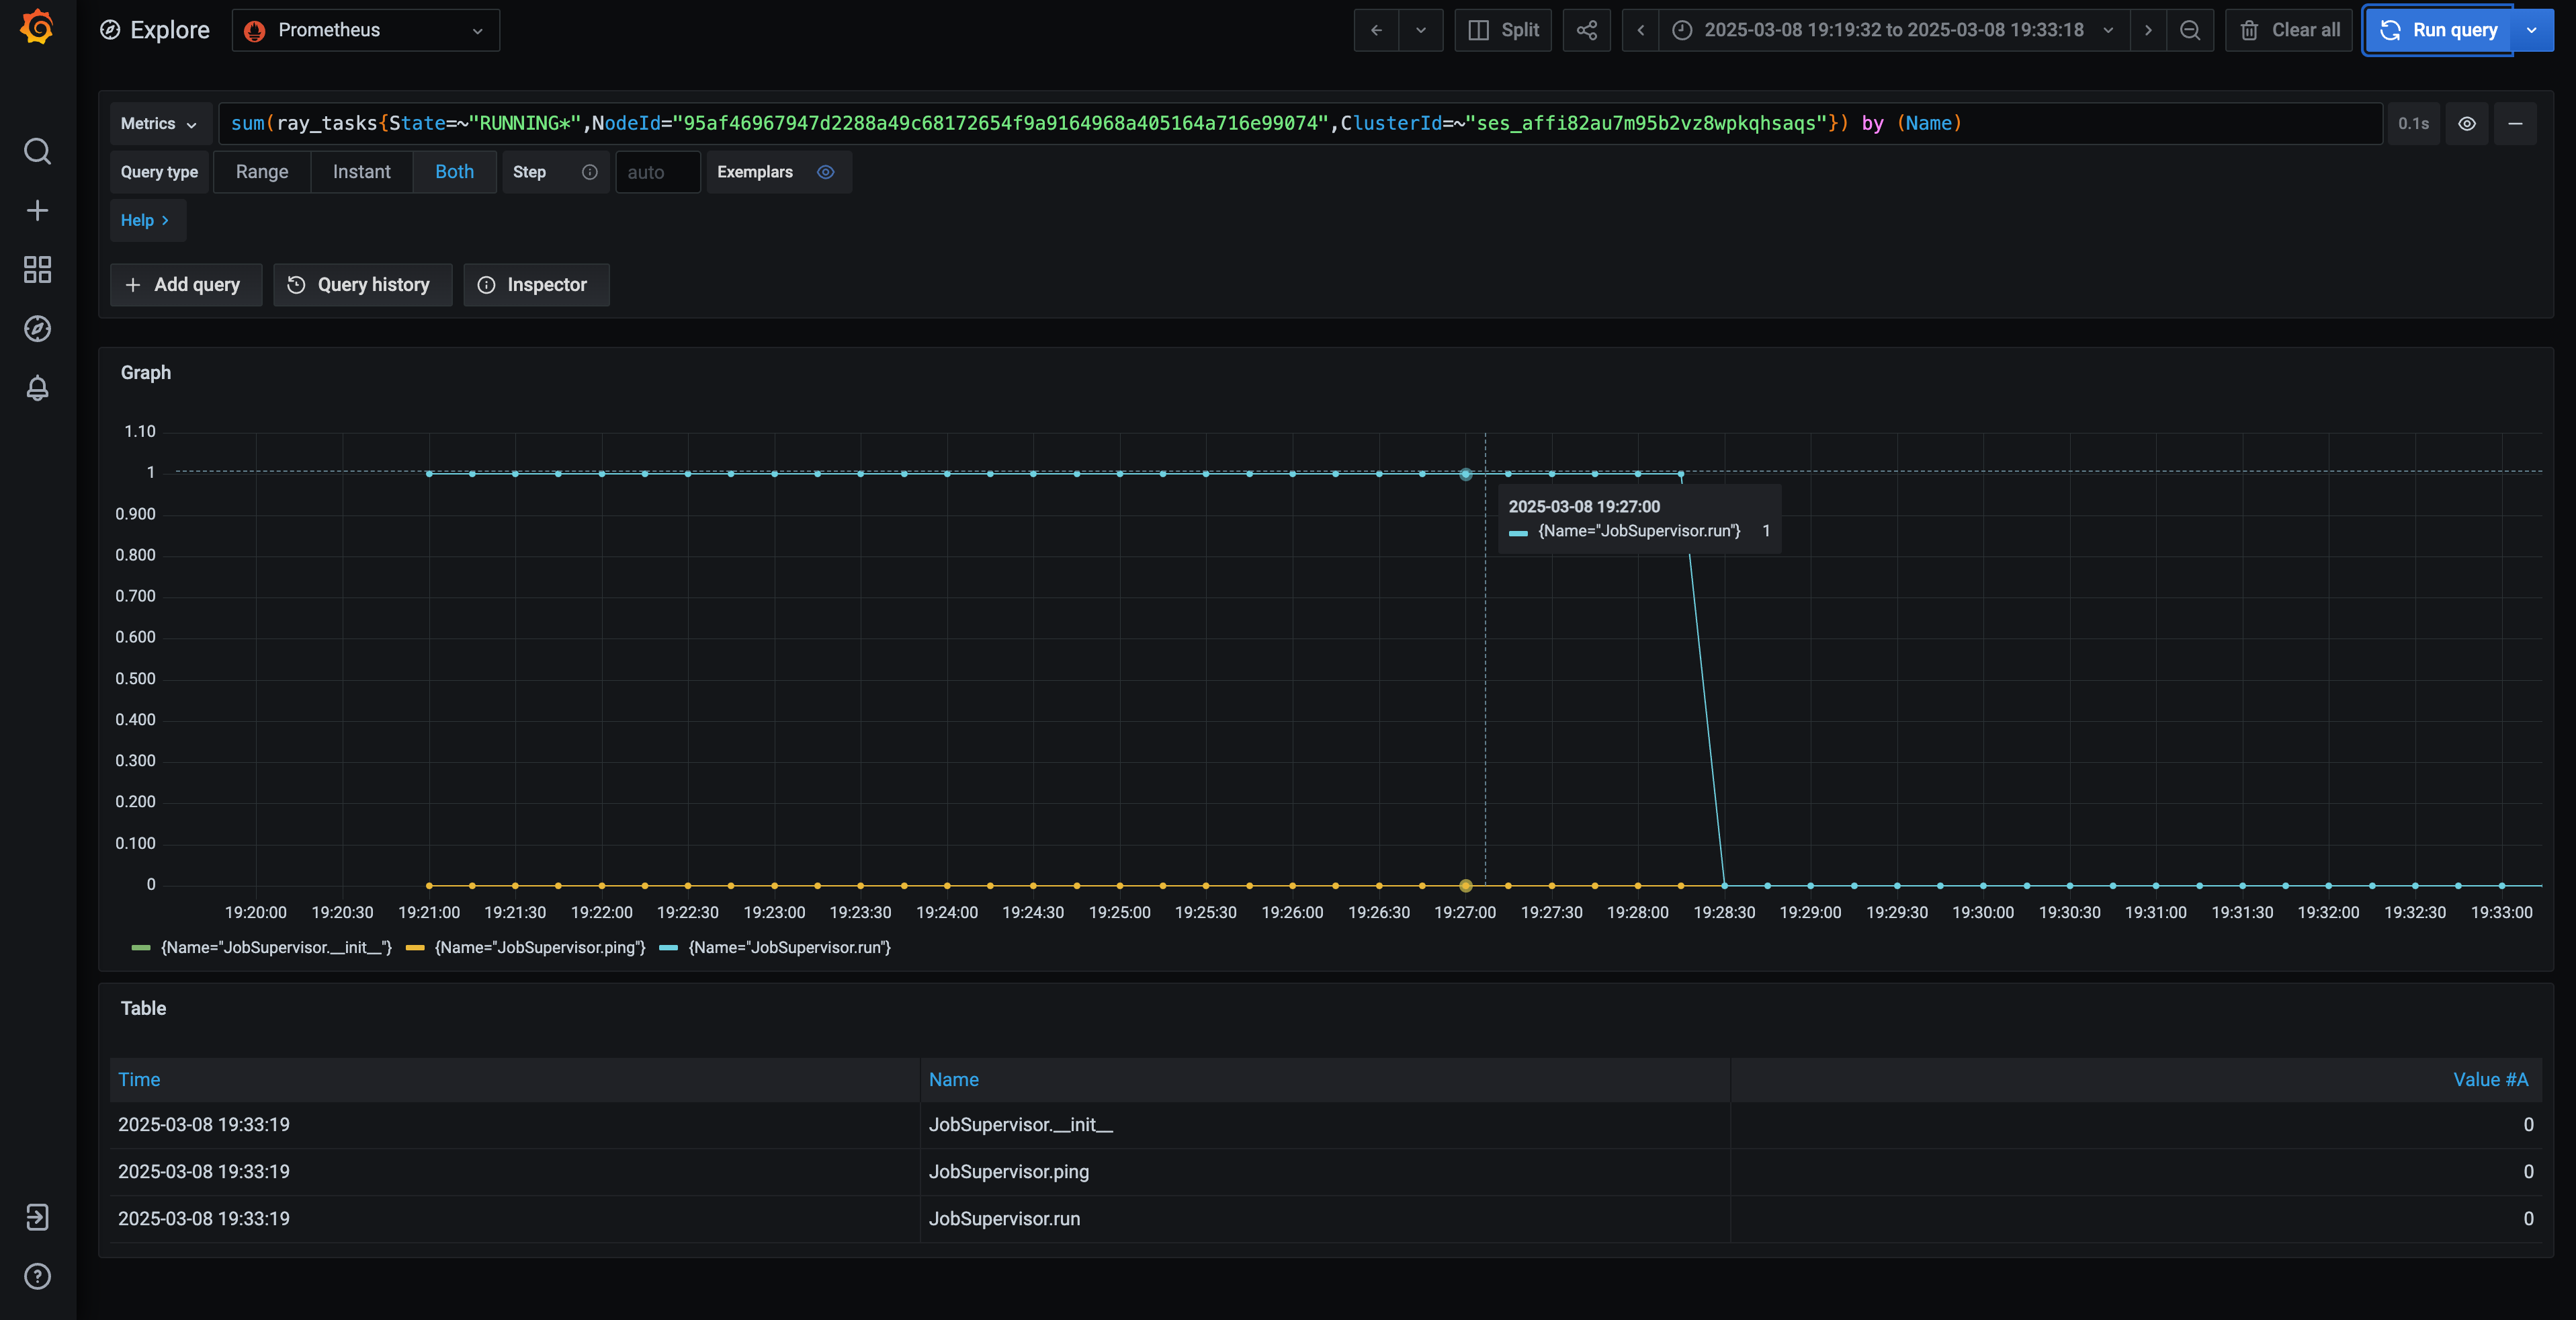
Additionally, investigate the task running on the head node (95af46967947d2288a49c68172654f9a9164968a405164a716e99074) at the time of failure. The task name, JobSupervisor.run, is an internal Ray task.
Based on the investigation, you can confidently conclude the following:
- The worker task
OOM.oom_runis the root cause of the OOM. - The head node, identified as the driver (
JobSupervisor.run) of the worker task above, consequently also experiences an OOM, ultimately leading to the cluster's failure. - The user should examine the content of the OOM.oom_run function and trace its usage in the main script, as its execution appears to trigger the cluster-wide OOM.
This documentation focuses on debugging Ray-specific workloads rather than general Python issues, the investigation concludes. However, for further assistance with debugging out-of-memory (OOM) issues in Ray task functions, you can use additional resources like the memray debugging guide.