Monitor a service
Monitor a service
Anyscale services provides several tools to monitor your service:
- Service detail page
- Deployment topology
- Metrics
- Logs
- Notifications
- Alerts
- Ray Dashboard
- Tracing
- Exporting logs and metrics
This document describes each use case and provides suggestions for when to use each tool.
Service detail page
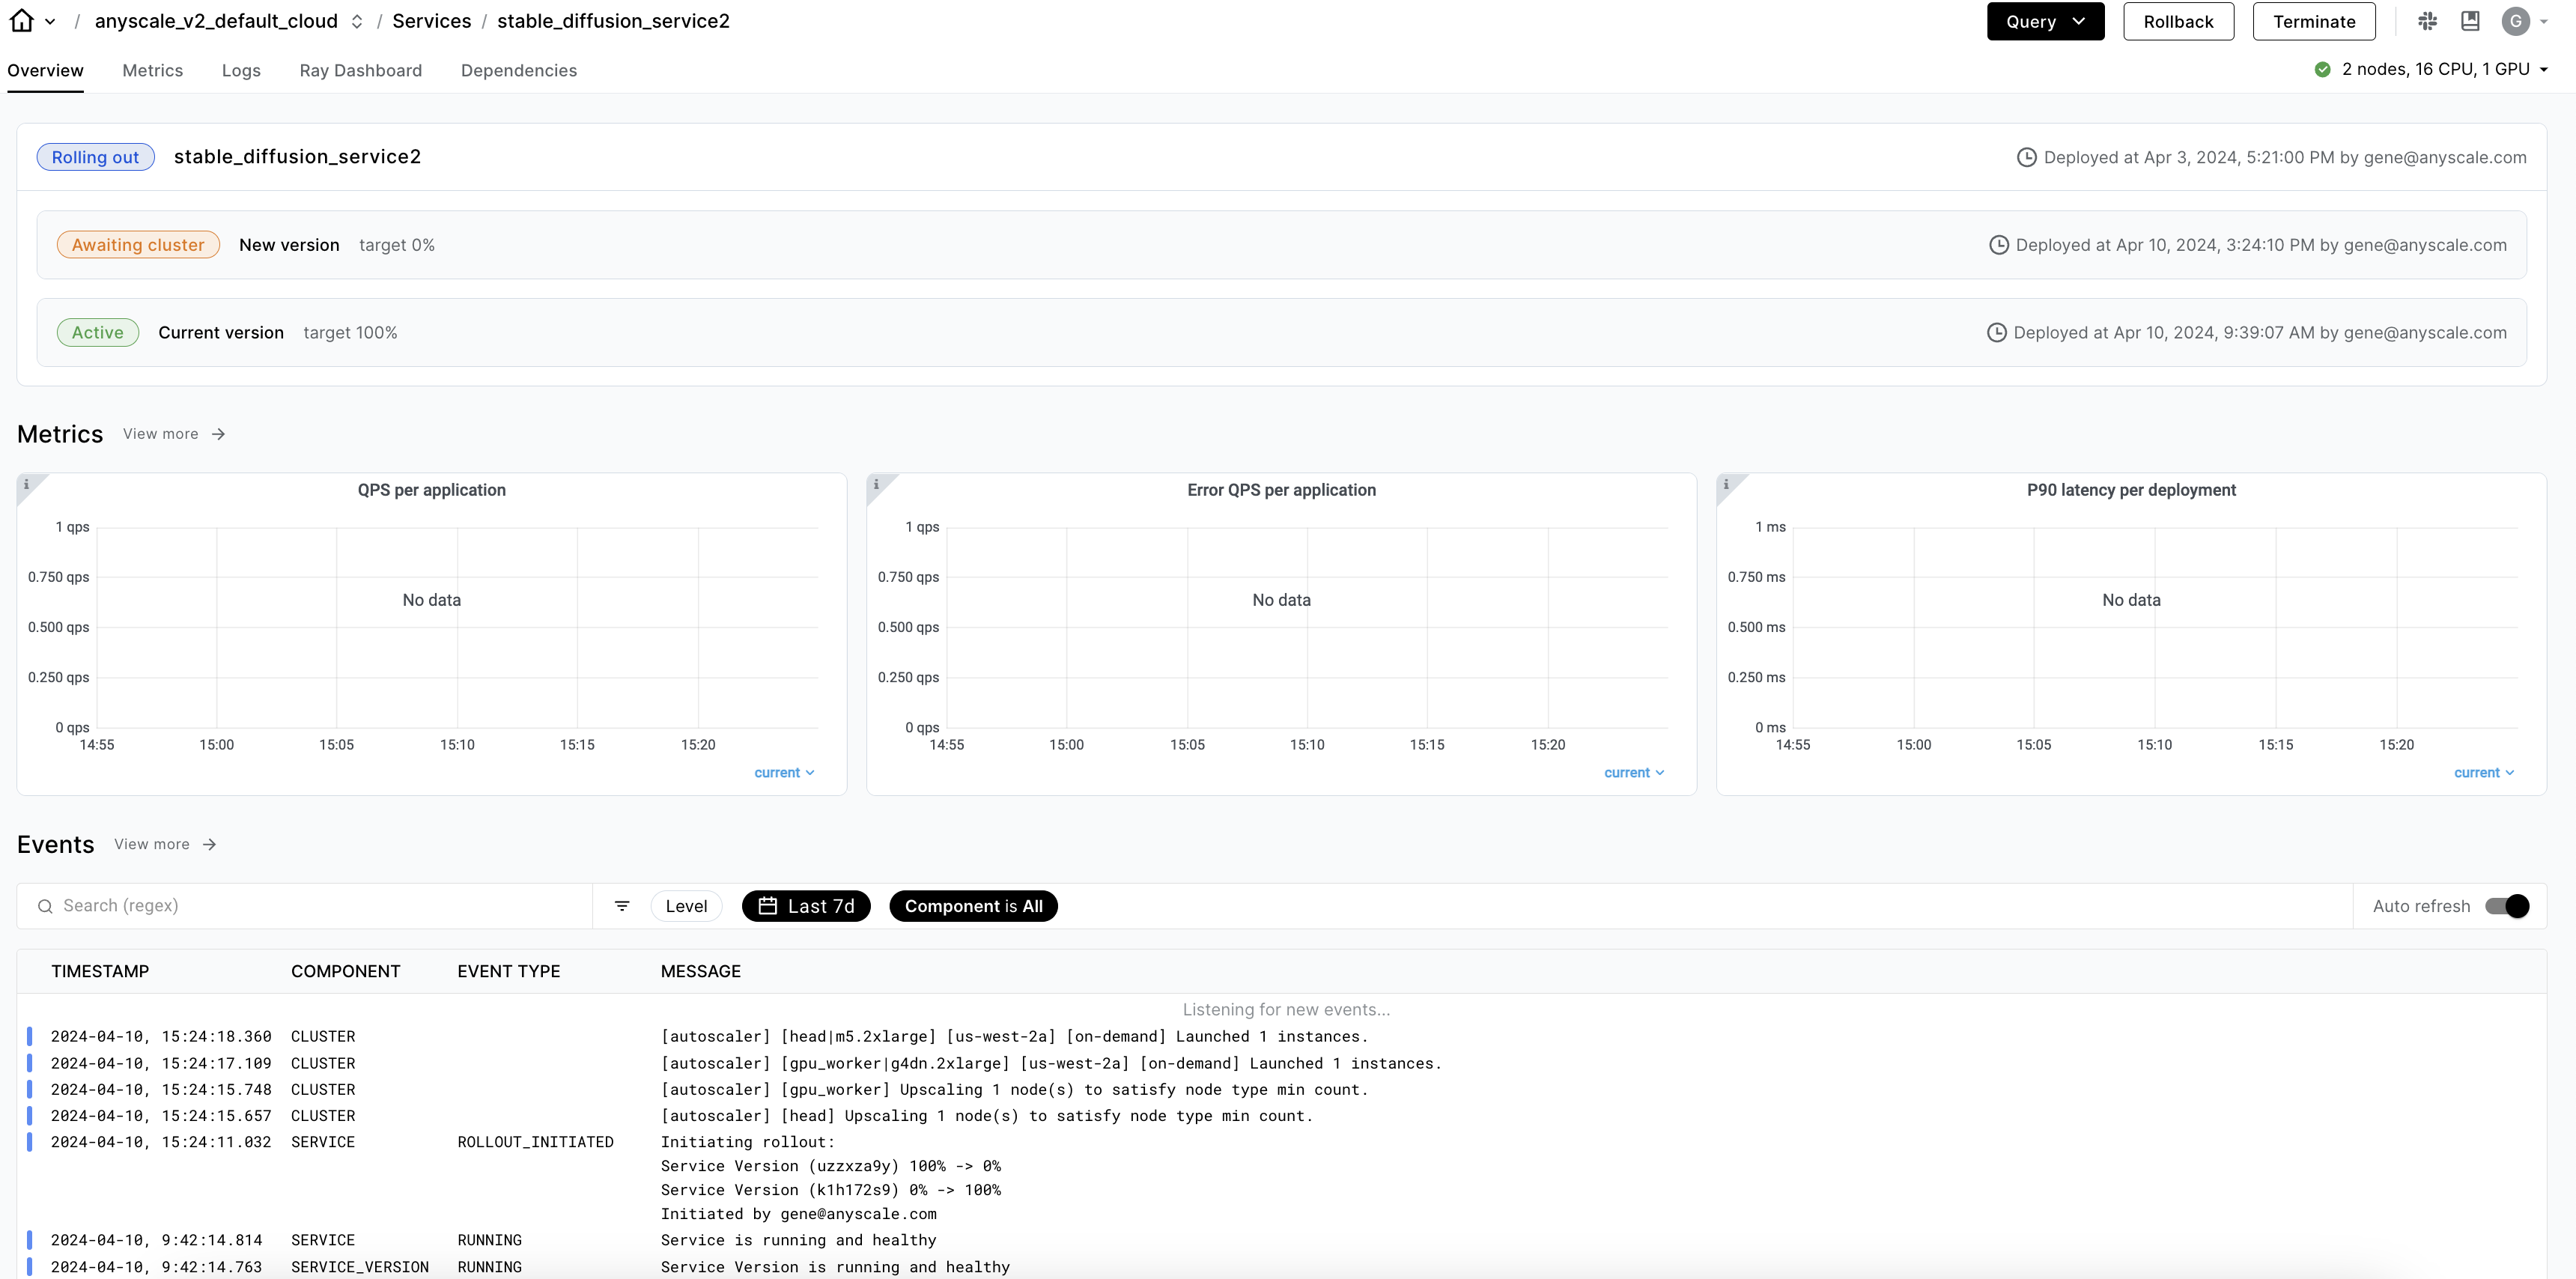
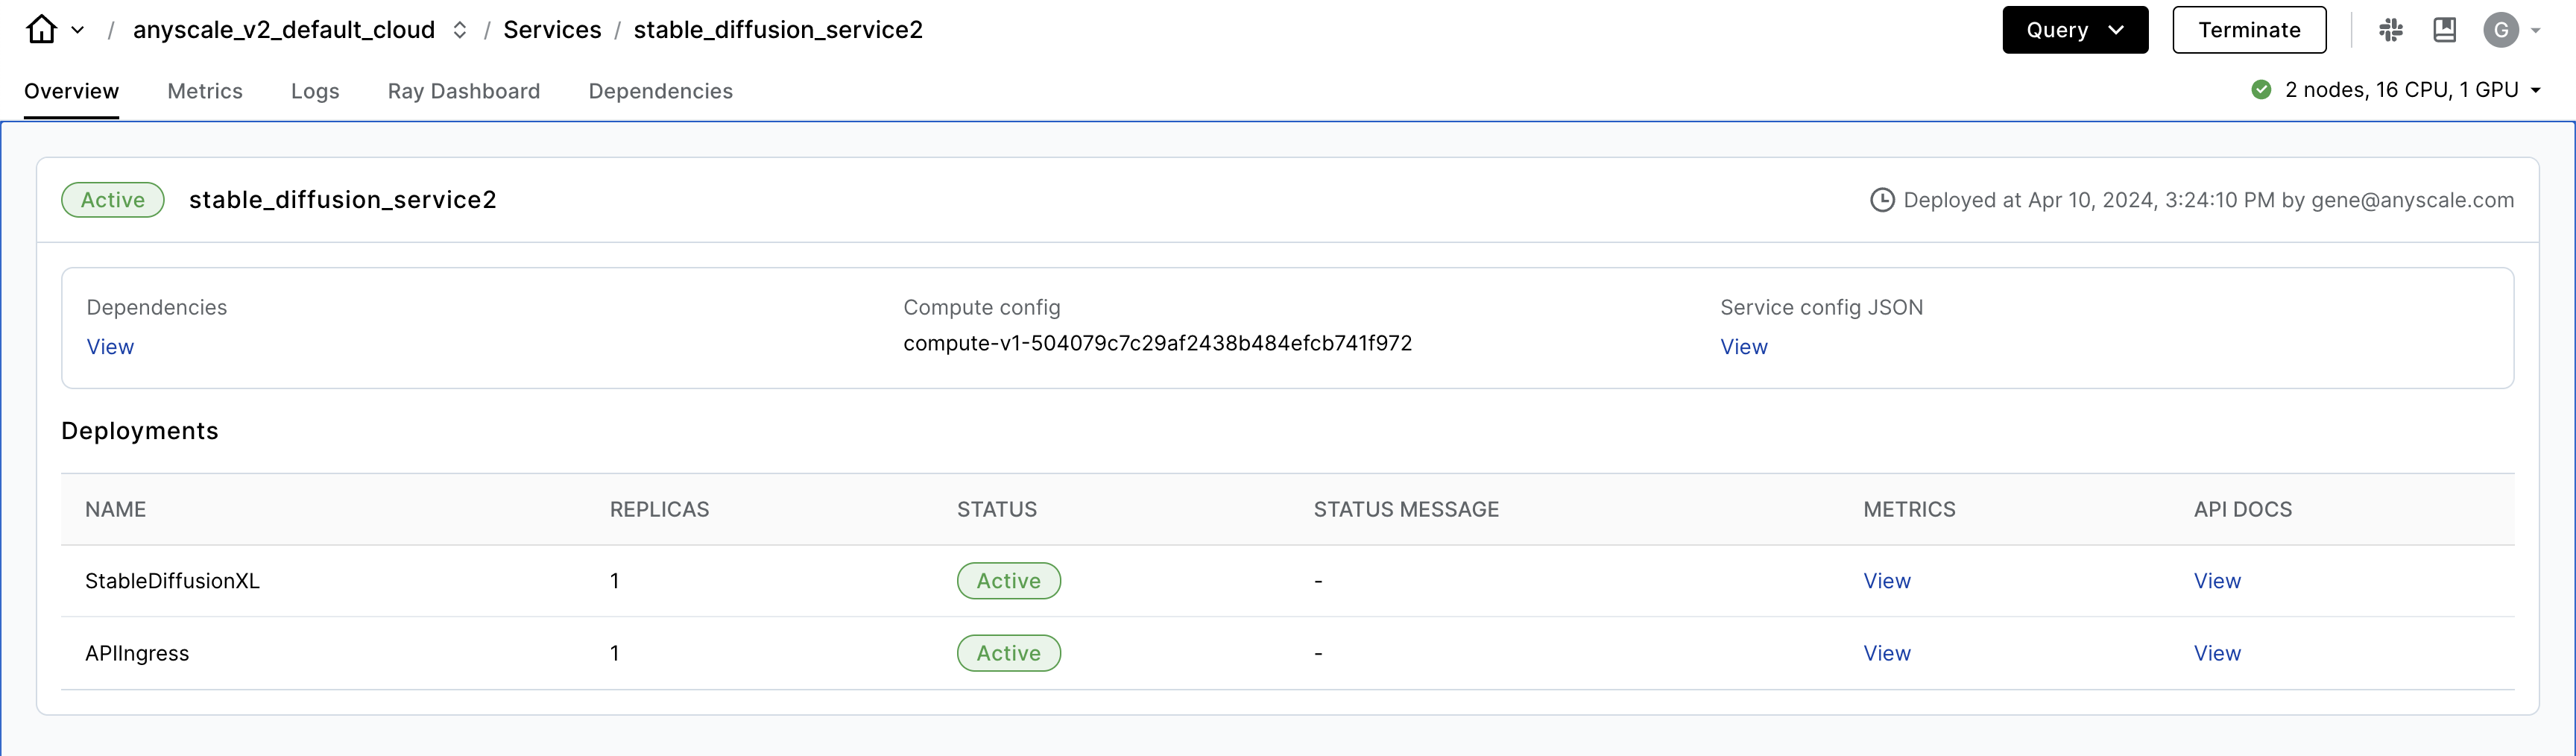
The service detail page contains the status of the service, information about your service's configuration, some high level metrics of the service, events of the service, and links to various other tools.
Click a service version to see a list of Ray Serve deployments at the top of the service detail page. Find the dependencies, configs, and the status of each deployment.
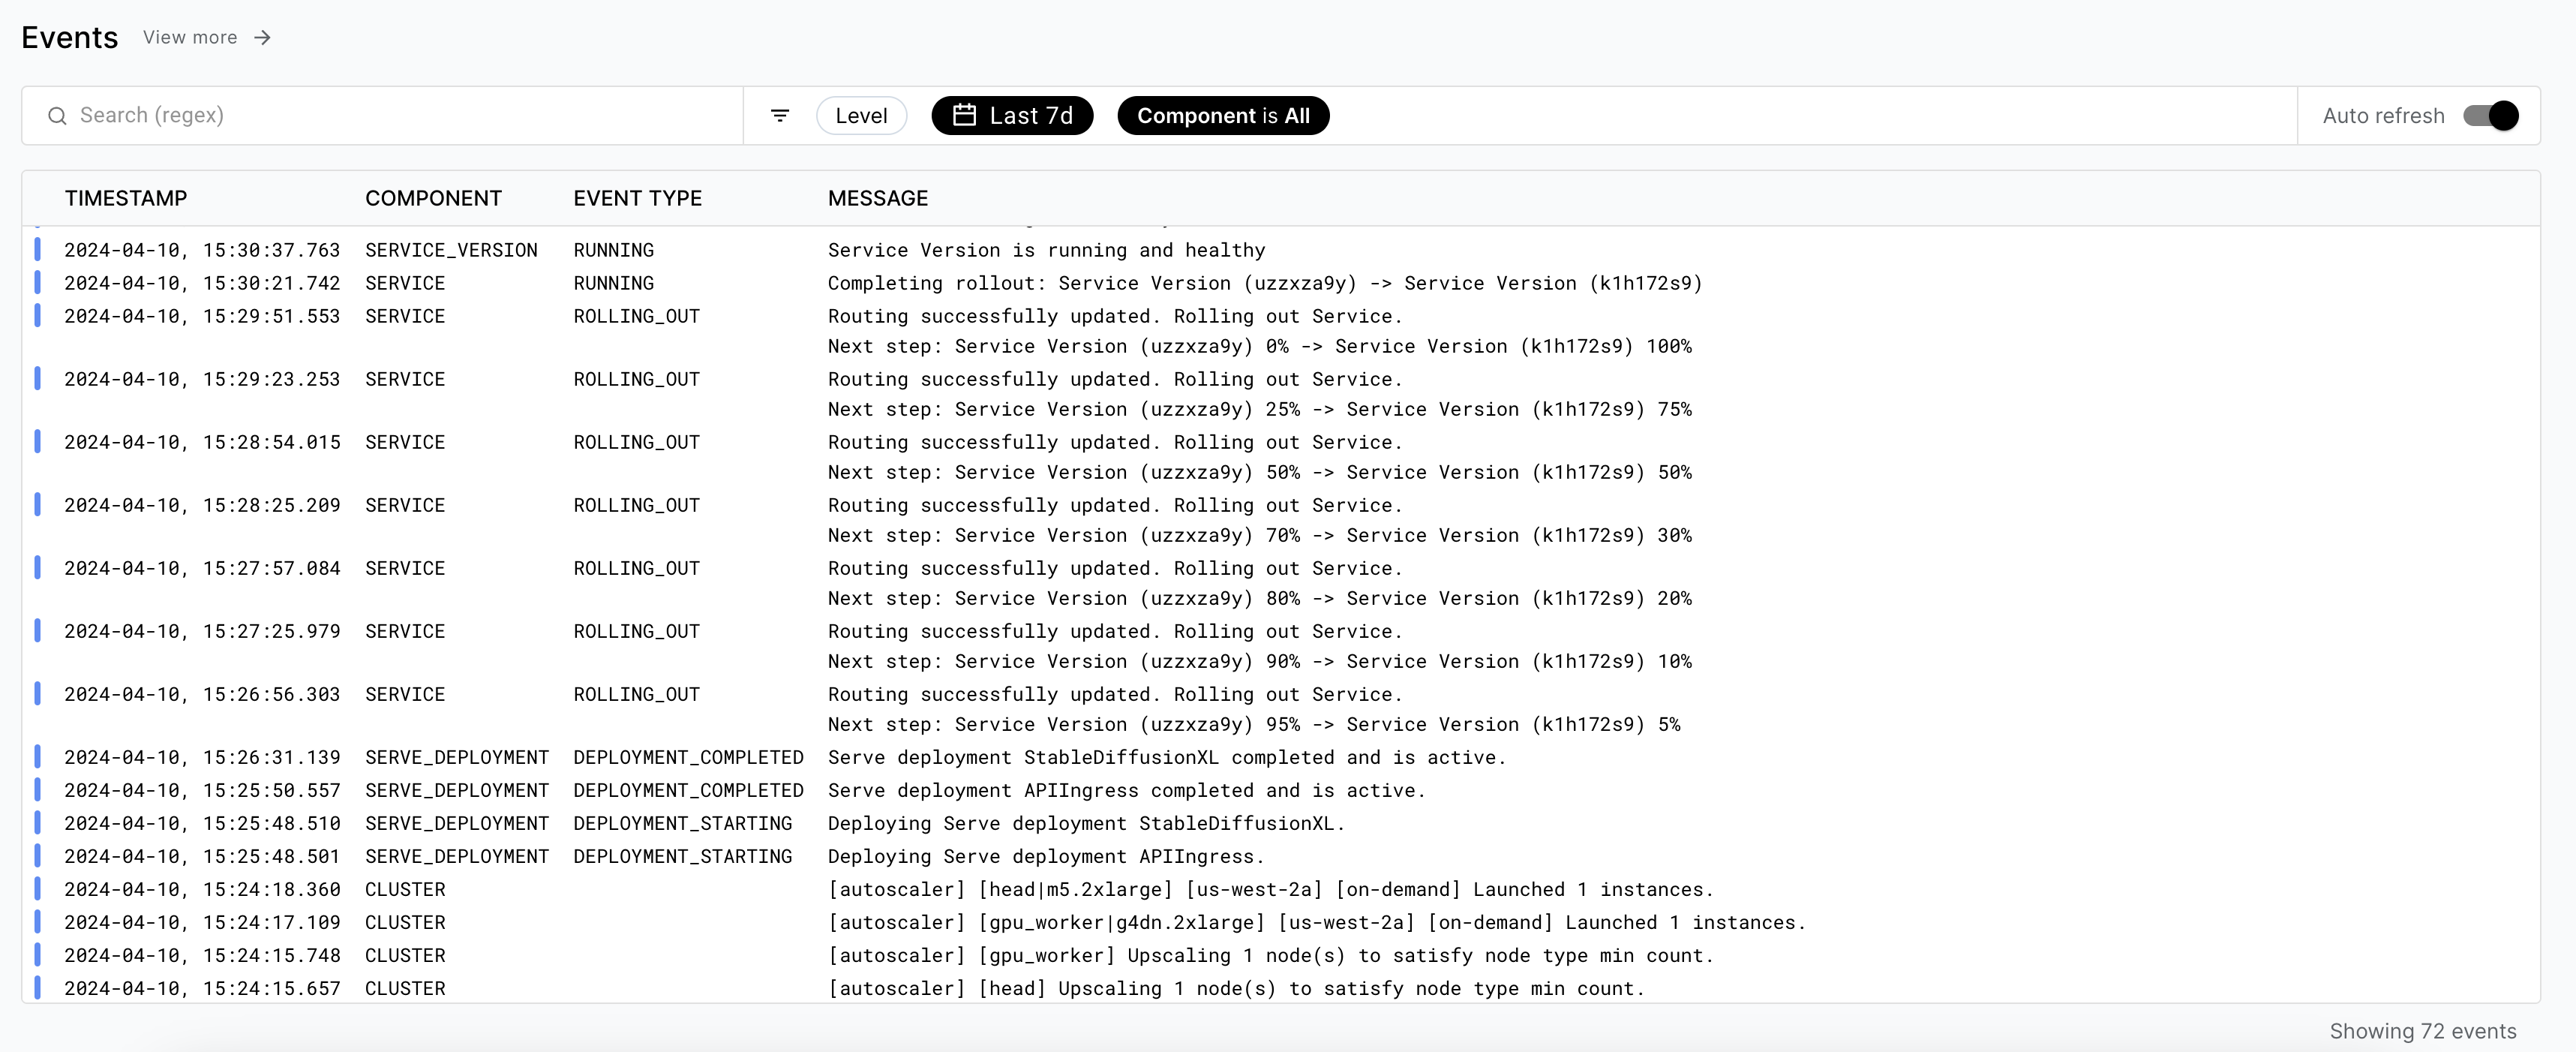
The service events log is at the bottom of the page. This log lists events to your service and includes events about your service lifecycle, rollouts, and errors. If the status of your service isn't what you expect, you can find the reason in the service events log.
Deployment topology
The deployment topology view on the service detail page shows how the Ray Serve deployments in your service connect. Anyscale infers the topology at runtime from your application code, so you don't need to configure it manually.
To open the topology view, click the View topology button in the relevant Application section.
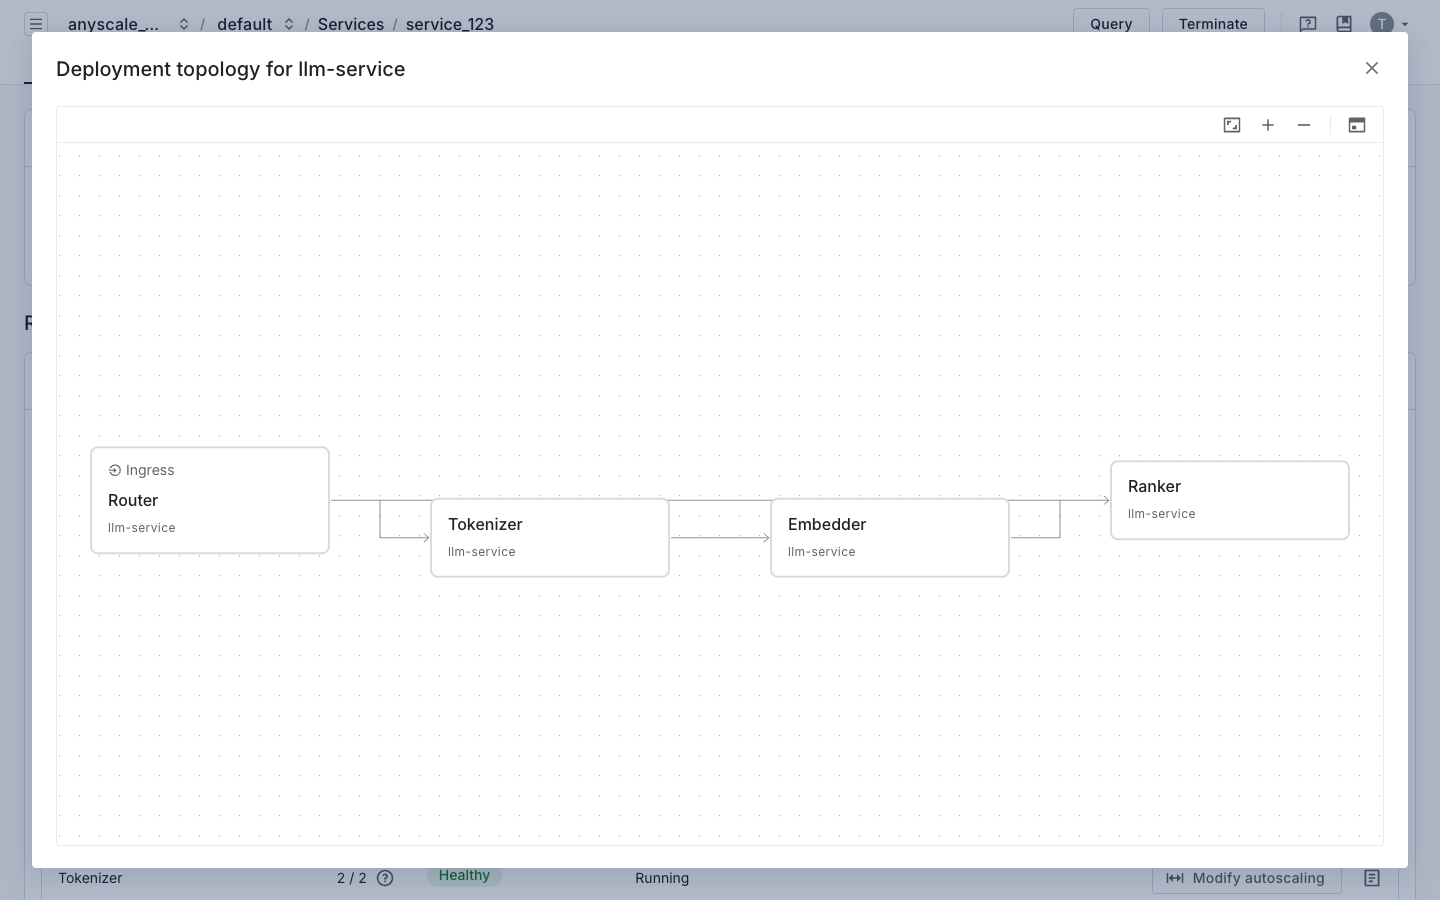
Each node represents a Ray Serve deployment, labeled with the deployment name and its parent application. The deployment that receives requests has an Ingress label, and arrows show the request flow between deployments.
Metrics
The service detail page shows some top level metrics shown. To access to the full metrics dashboard, click the "Metrics" tab in the service detail page.
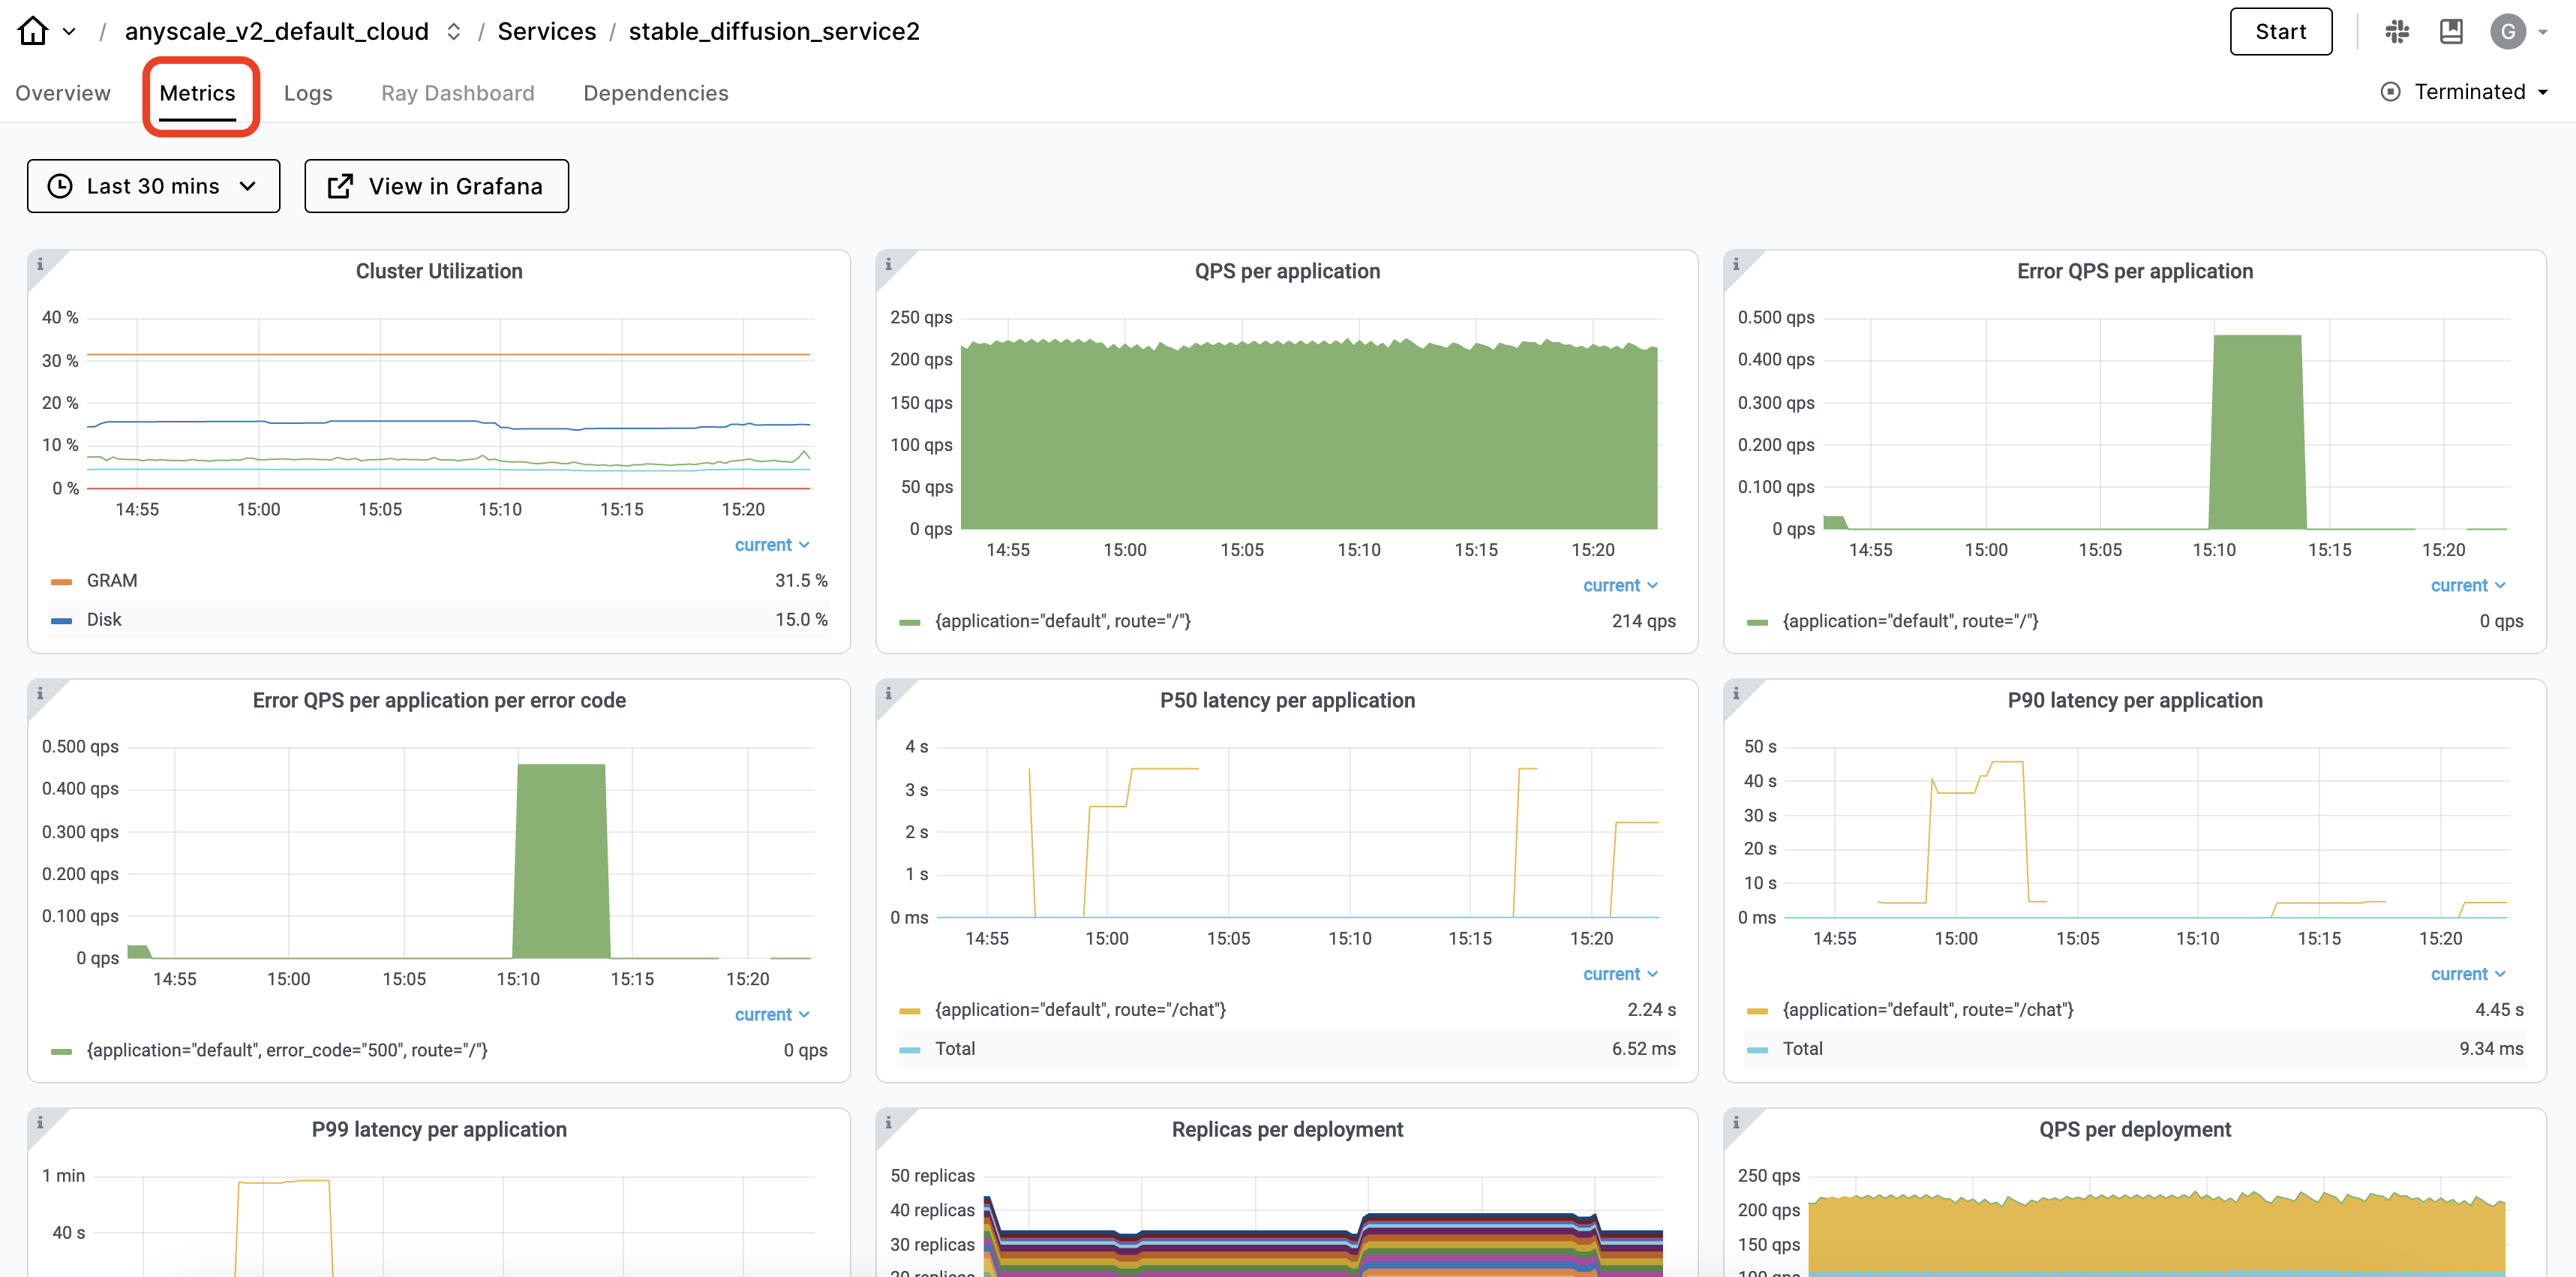
Service metrics tracks application-level metrics such as the number of requests, latency, and error rate. It also shows hardware metrics such as:
- CPU or network utilization
- Memory or disk usage
- Node count
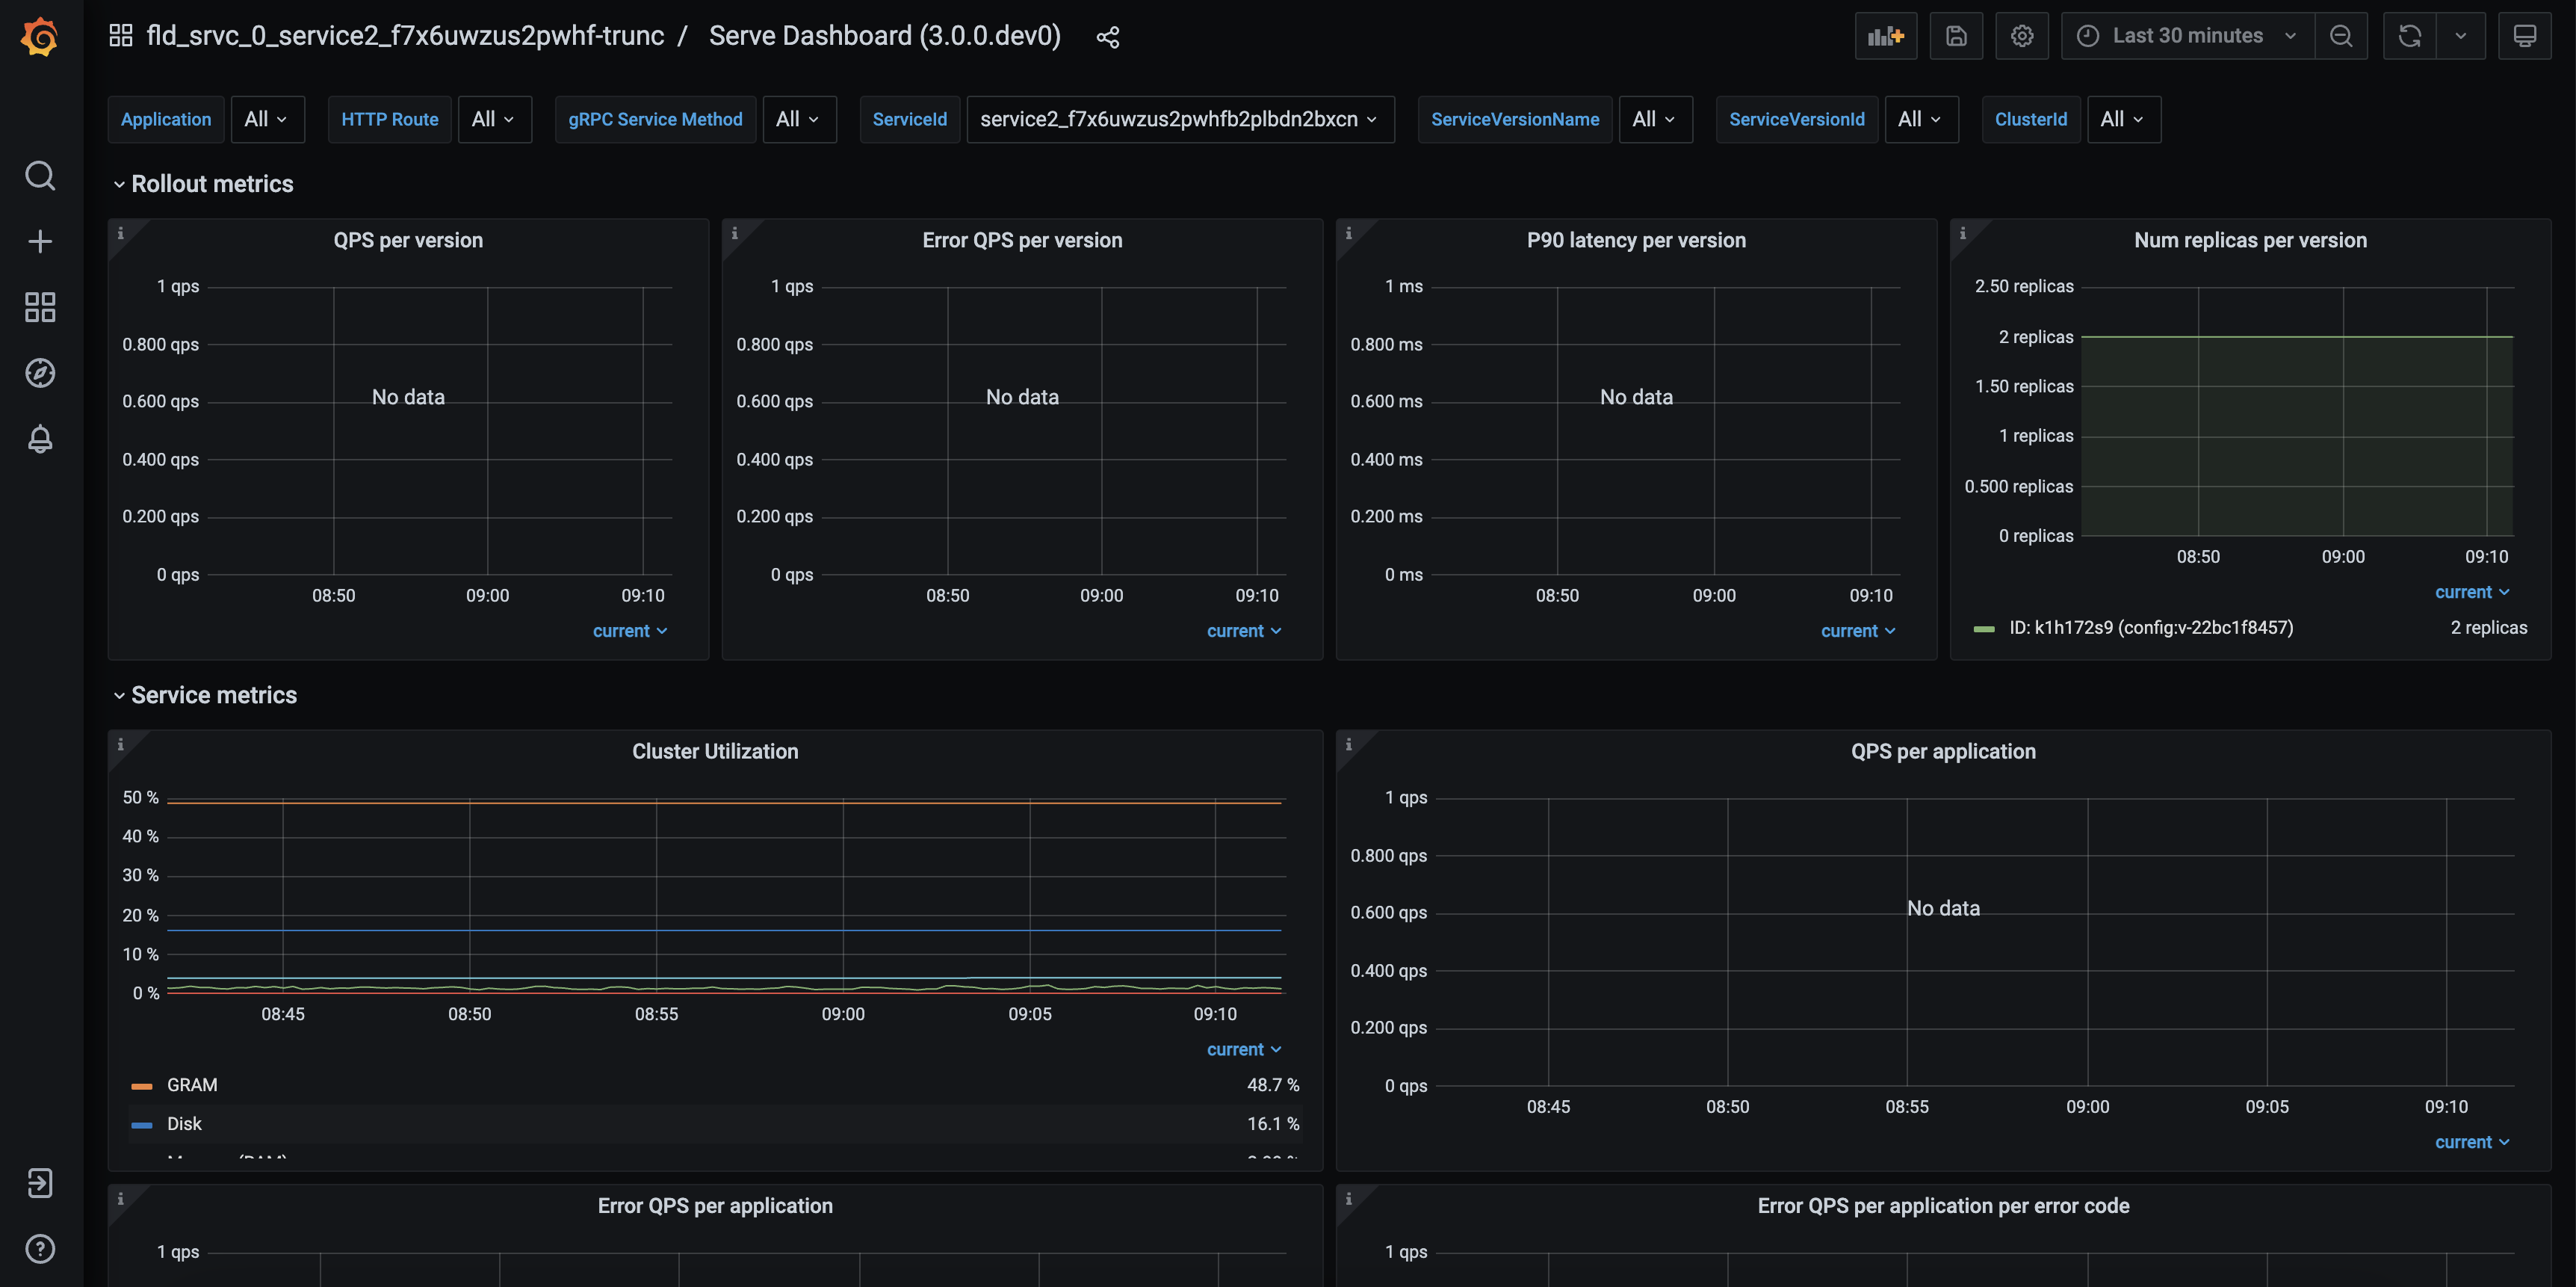
This page is powered by Grafana. You can get onto Grafana directly by clicking the "View in Grafana" button. Use the dropdown menus at the top of the dashboard to filter specific applications and routes.
The top row of the section contains "rollout metrics." High level metrics are split out by service version, so you can compare the performance of each service version. If the performance drops, you can decide to roll back a rollout.
The rest of the dashboard contains "service metrics," which shows the data across all service versions. You can track metrics over time, regardless of the rollouts that have occurred during that time.
Logs
Logs are another source of information when debugging issues with your service. You can view the logs of your service by clicking the "Logs" tab in the service detail page.
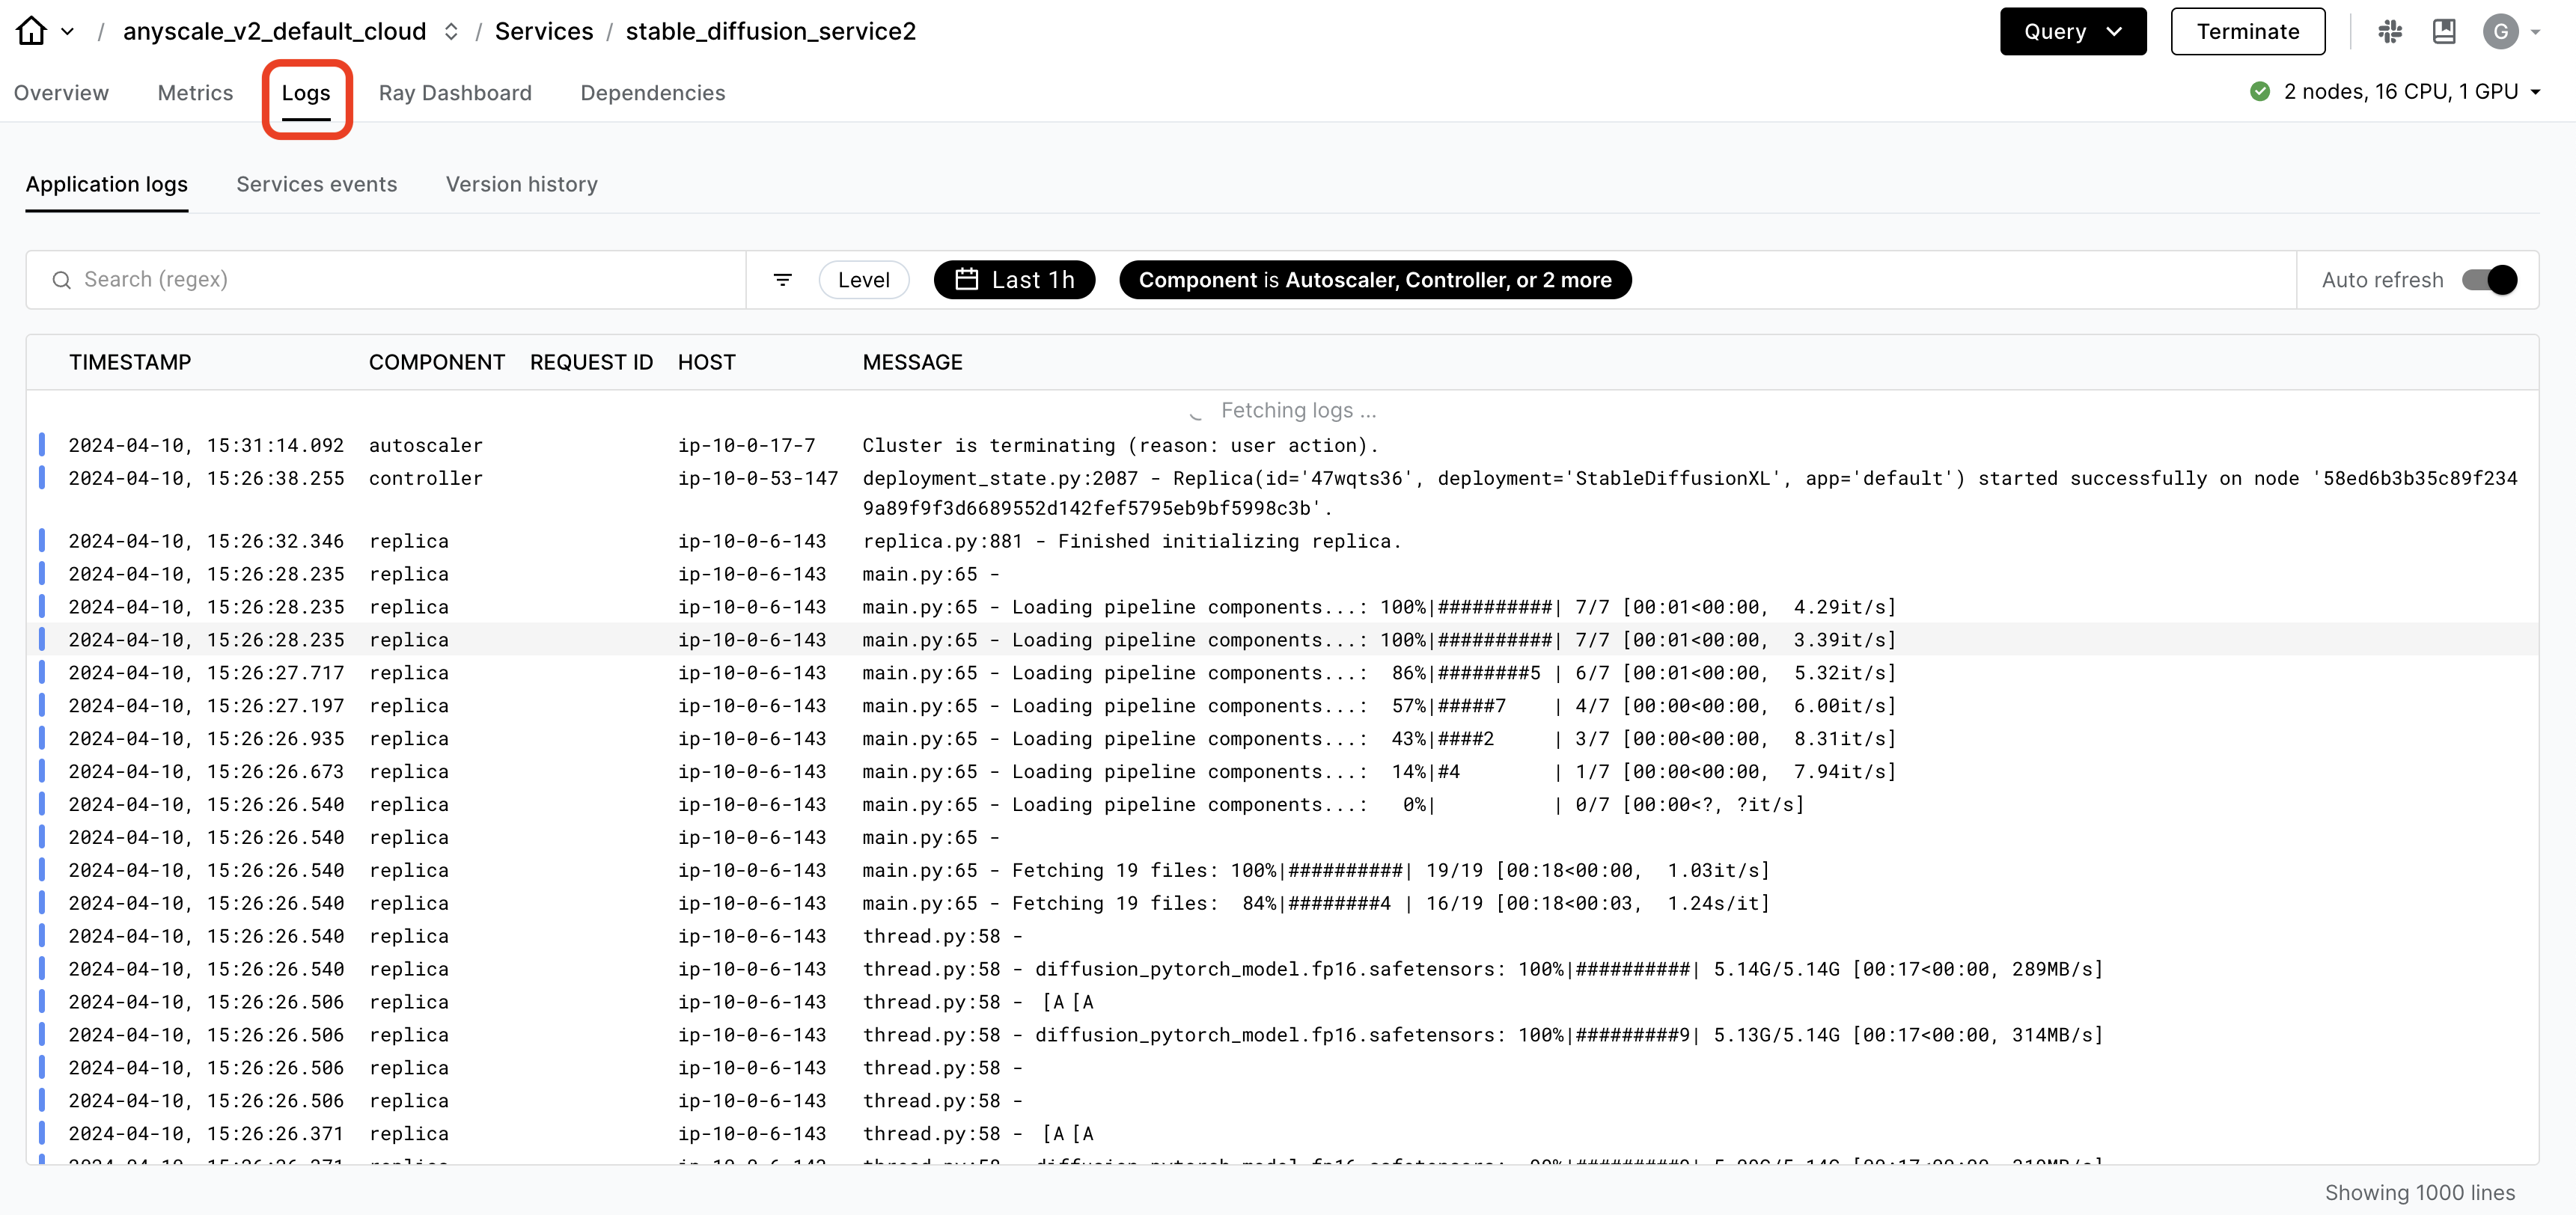
By default, the logs are shown in the last hour with no filters. You can change the time range by clicking the time range dropdown and select an end time and time window to look back. Anyscale stores up to 30 days of logs for your service. You are able to debug issues even after the service terminates.
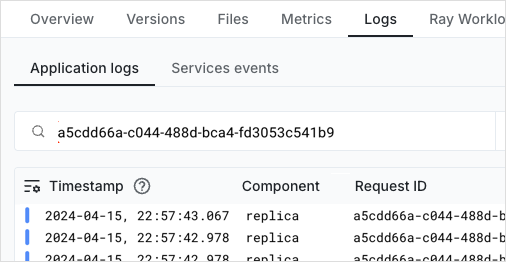
To filter the logs, use the search bar to search for specific keywords. Enter a request ID in the search bar to filter logs for a specific request. You can also use regex to filter logs if your logs contain a specific pattern.
Anyscale services make the best effort to redirect logs from your Ray Serve apps to the services logs. However, for the best log viewing and querying experience, follow the guide on Ray logging to set up logging in your Ray Serve apps.
Notifications
Anyscale services have a built-in notifications for when a service becomes unhealthy (due to health check failure), when it recovers, and when rollouts succeed or fail. The creator of the service receives an email notification whenever this happens. As an admin, you can also create Custom notifications such as additional emails or slack channels.
Alerts
There are a default set of metric-based alerts for each Service. This can be accessed by clicking the Manage alerts button in the Metrics tab of the service detail page.
To set up additional alerts based on your own criteria, see Custom dashboards and alerting guide. These alerts are useful for setting alerts on other indicators of the health of your service.
Ray Dashboard
The Ray Dashboard is scoped to a single Ray cluster. Each service version has one Ray cluster. To access to this dashboard, click the "Ray Dashboard" tab in the service detail page.
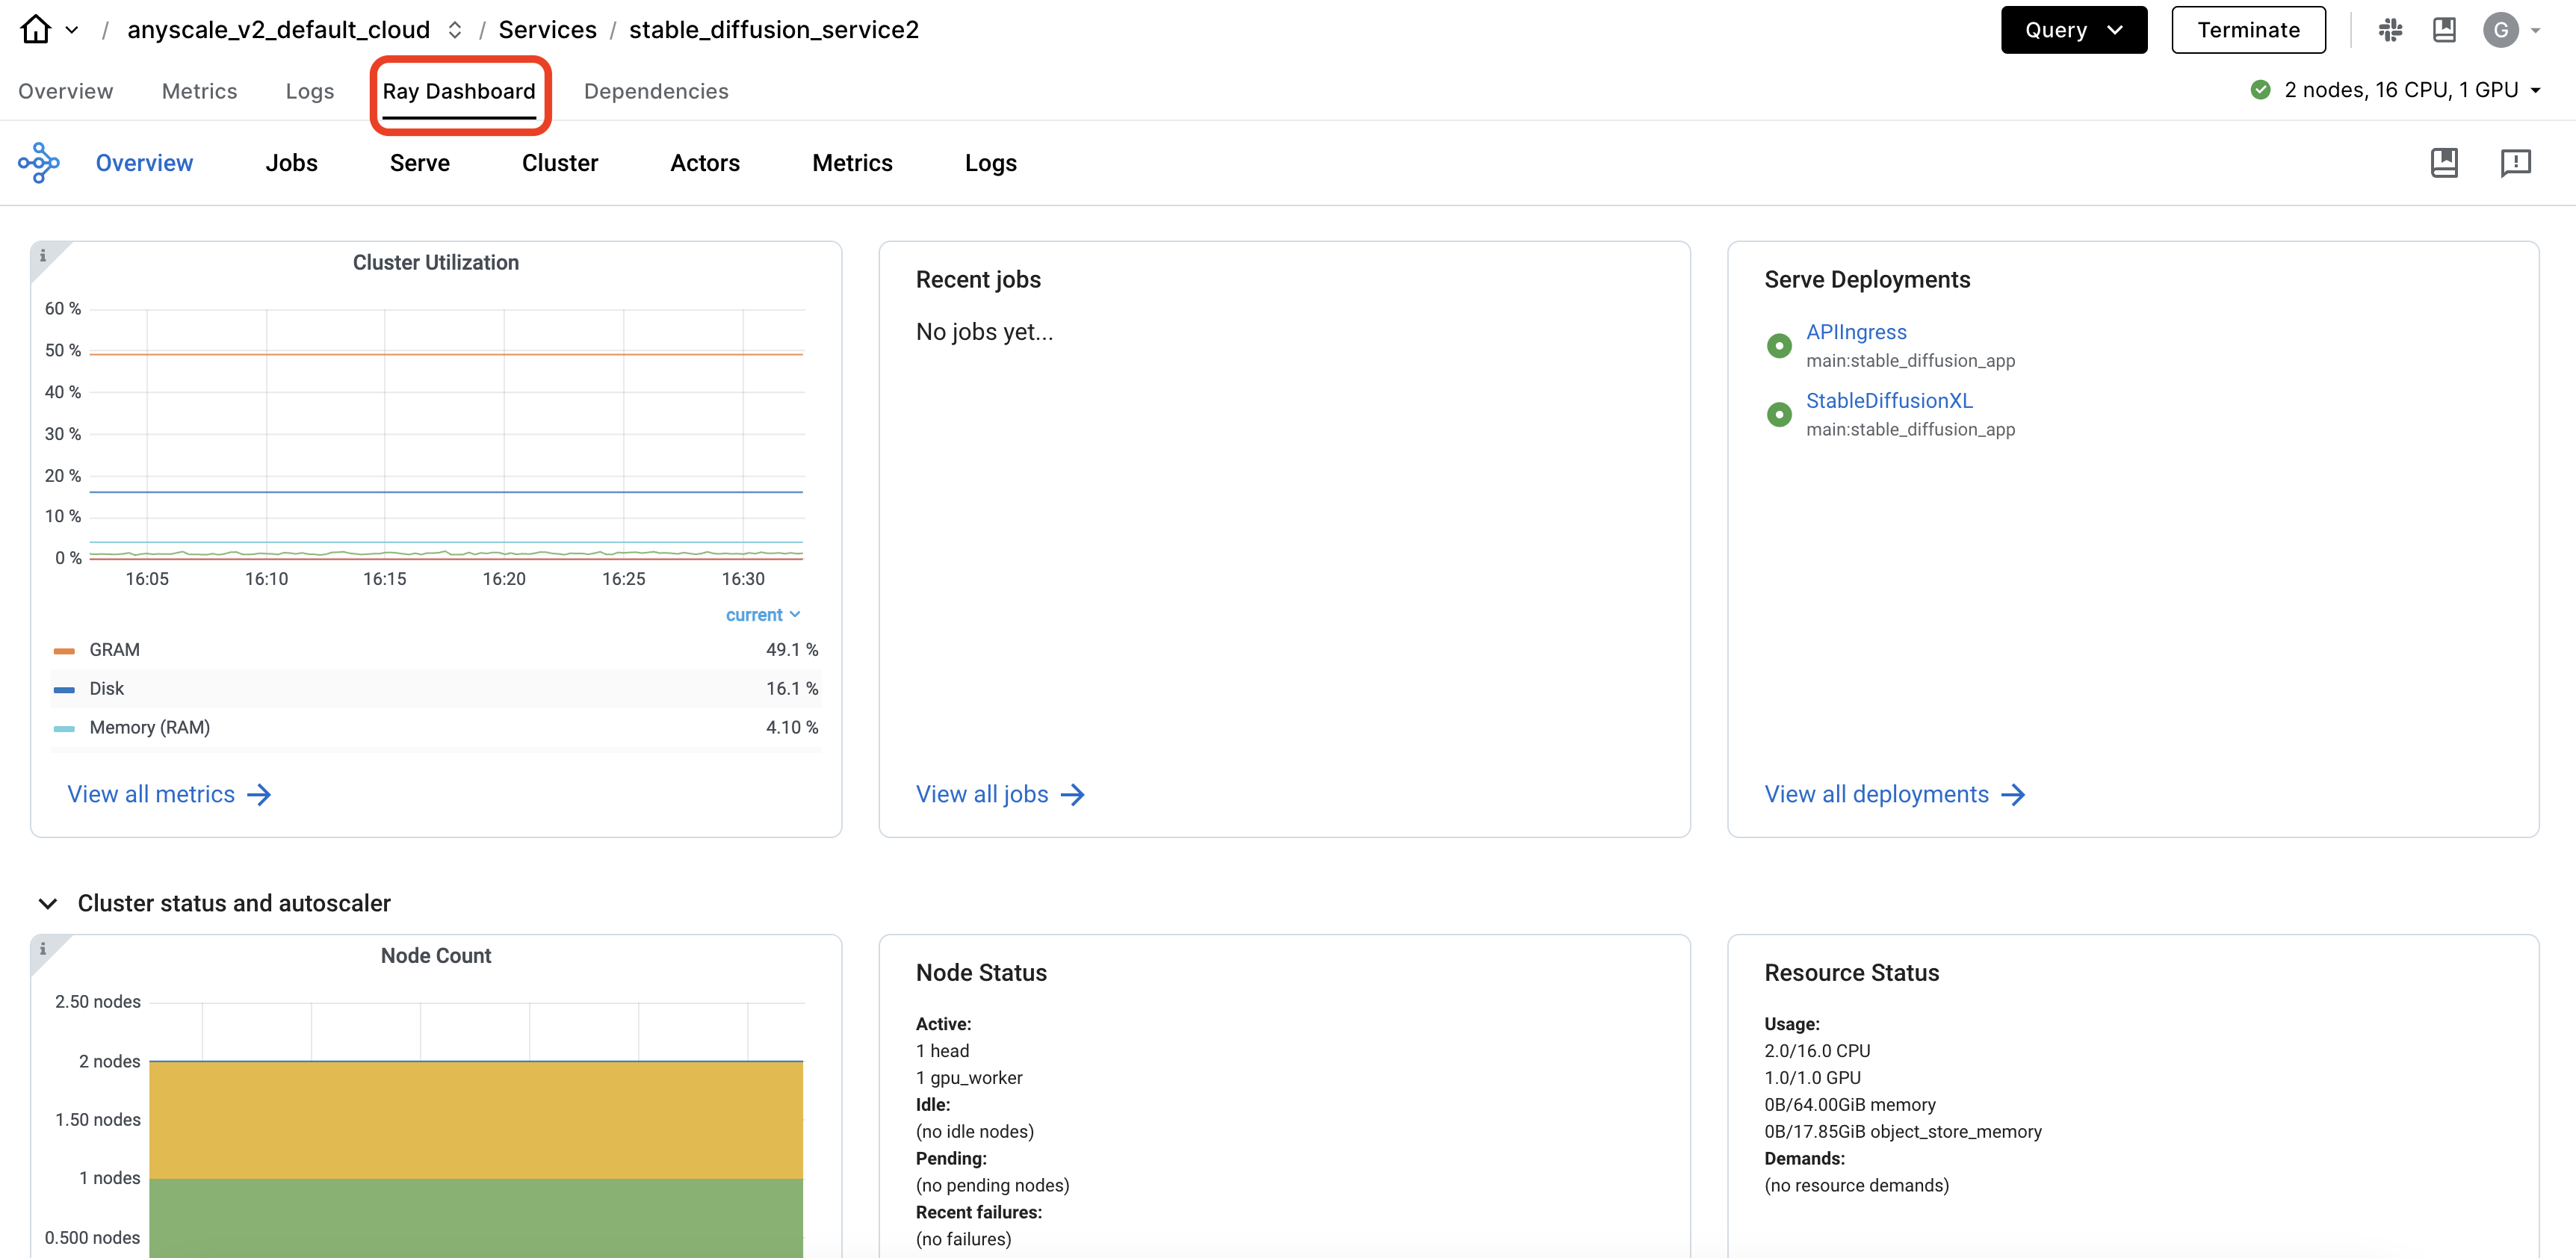
The Ray Dashboard Serve page is a tool to view the status of your Ray Serve apps and Ray Serve system components. The Ray Serve page helps you understand the health of your app, and find additional detail to debug apps.
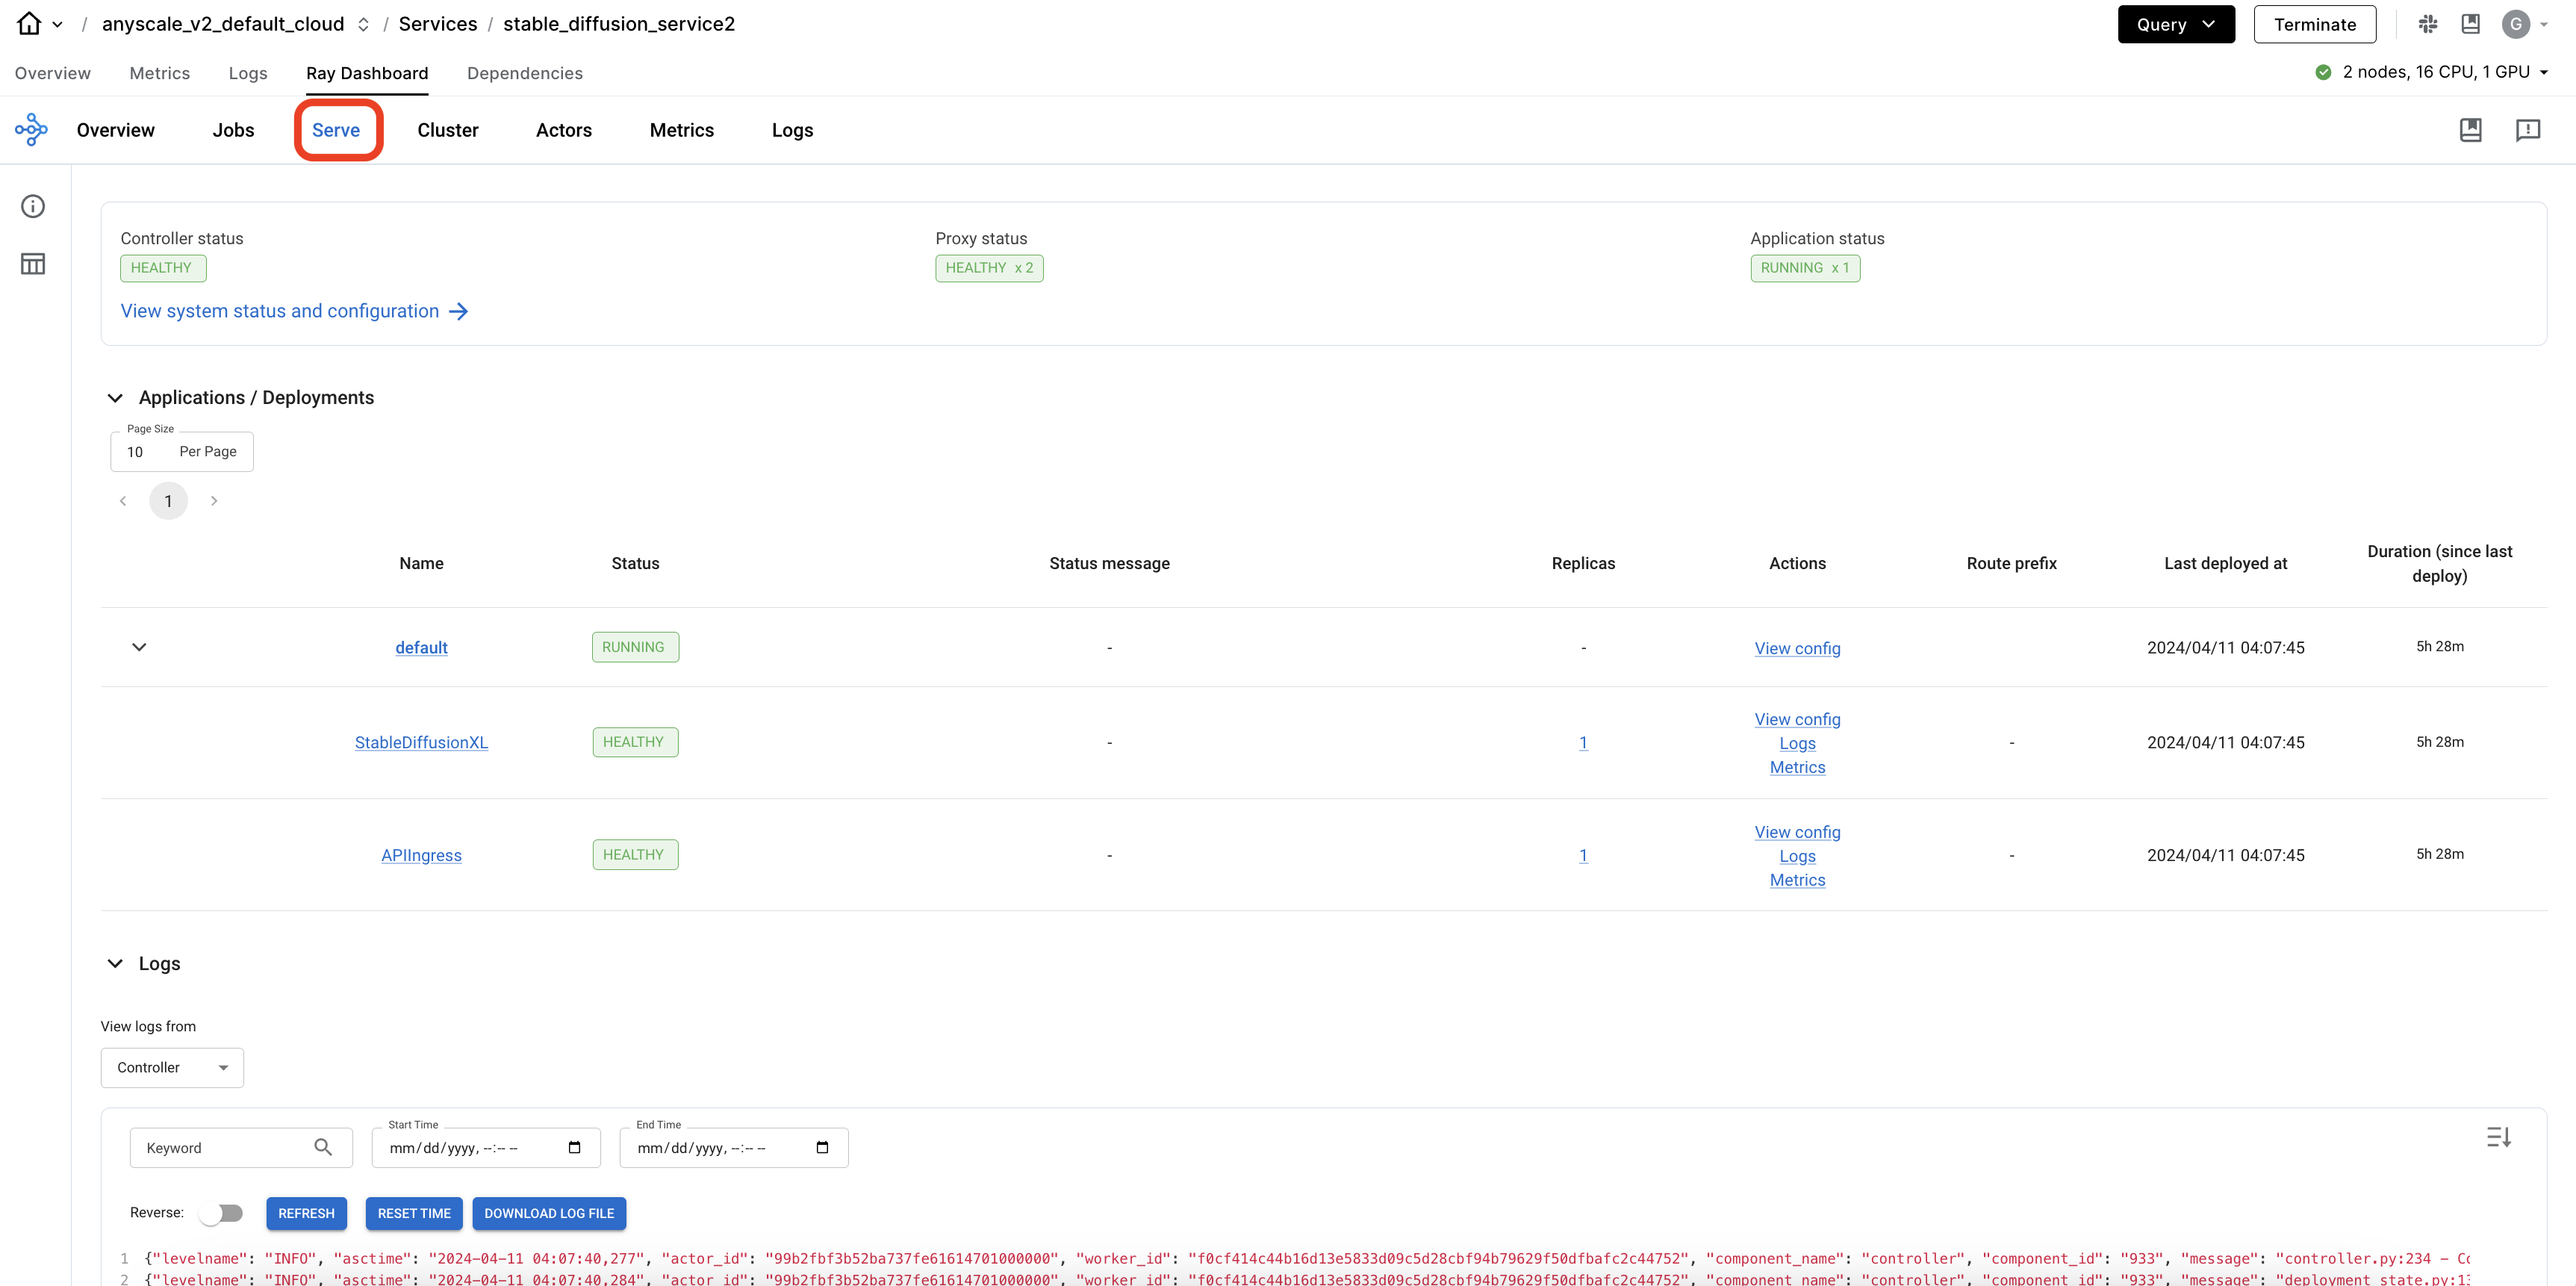
The top section shows Ray Serve system component status, such as the Serve Controller and proxies for each node. You can see if components are healthy. Click into the details of those components, to see logs related to those components. The Serve Controller logs can be a useful source of information when debugging issues with the deployment of your Ray Serve deployments and replicas. The proxy logs can be useful to understand if your service is receiving requests as expected.
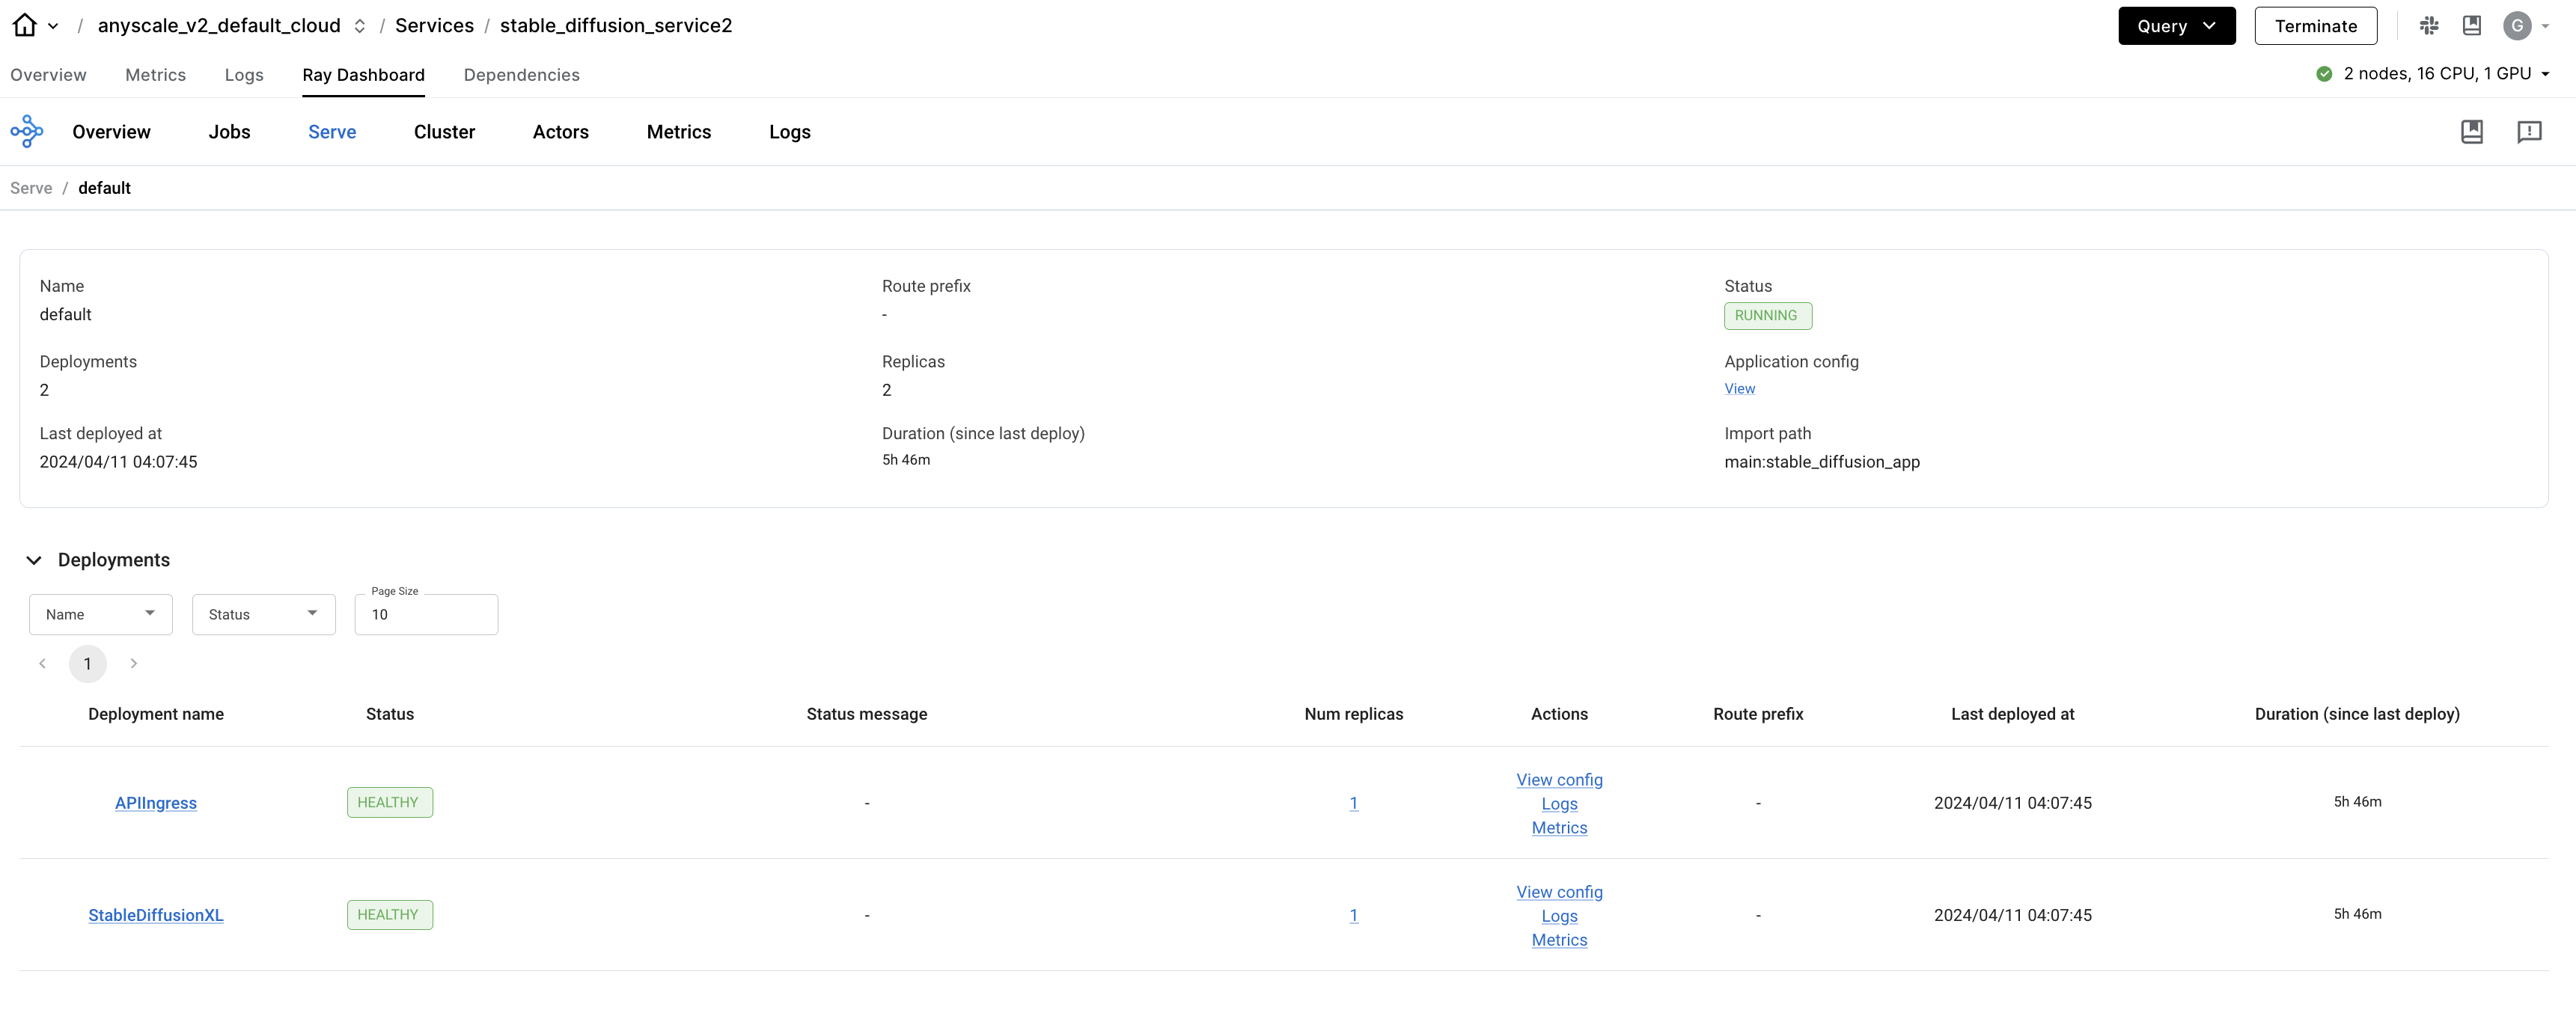
The bottom section of the Serve page shows details of your Ray Serve apps. You can see a high level status of each application or you can click into an app to see details.
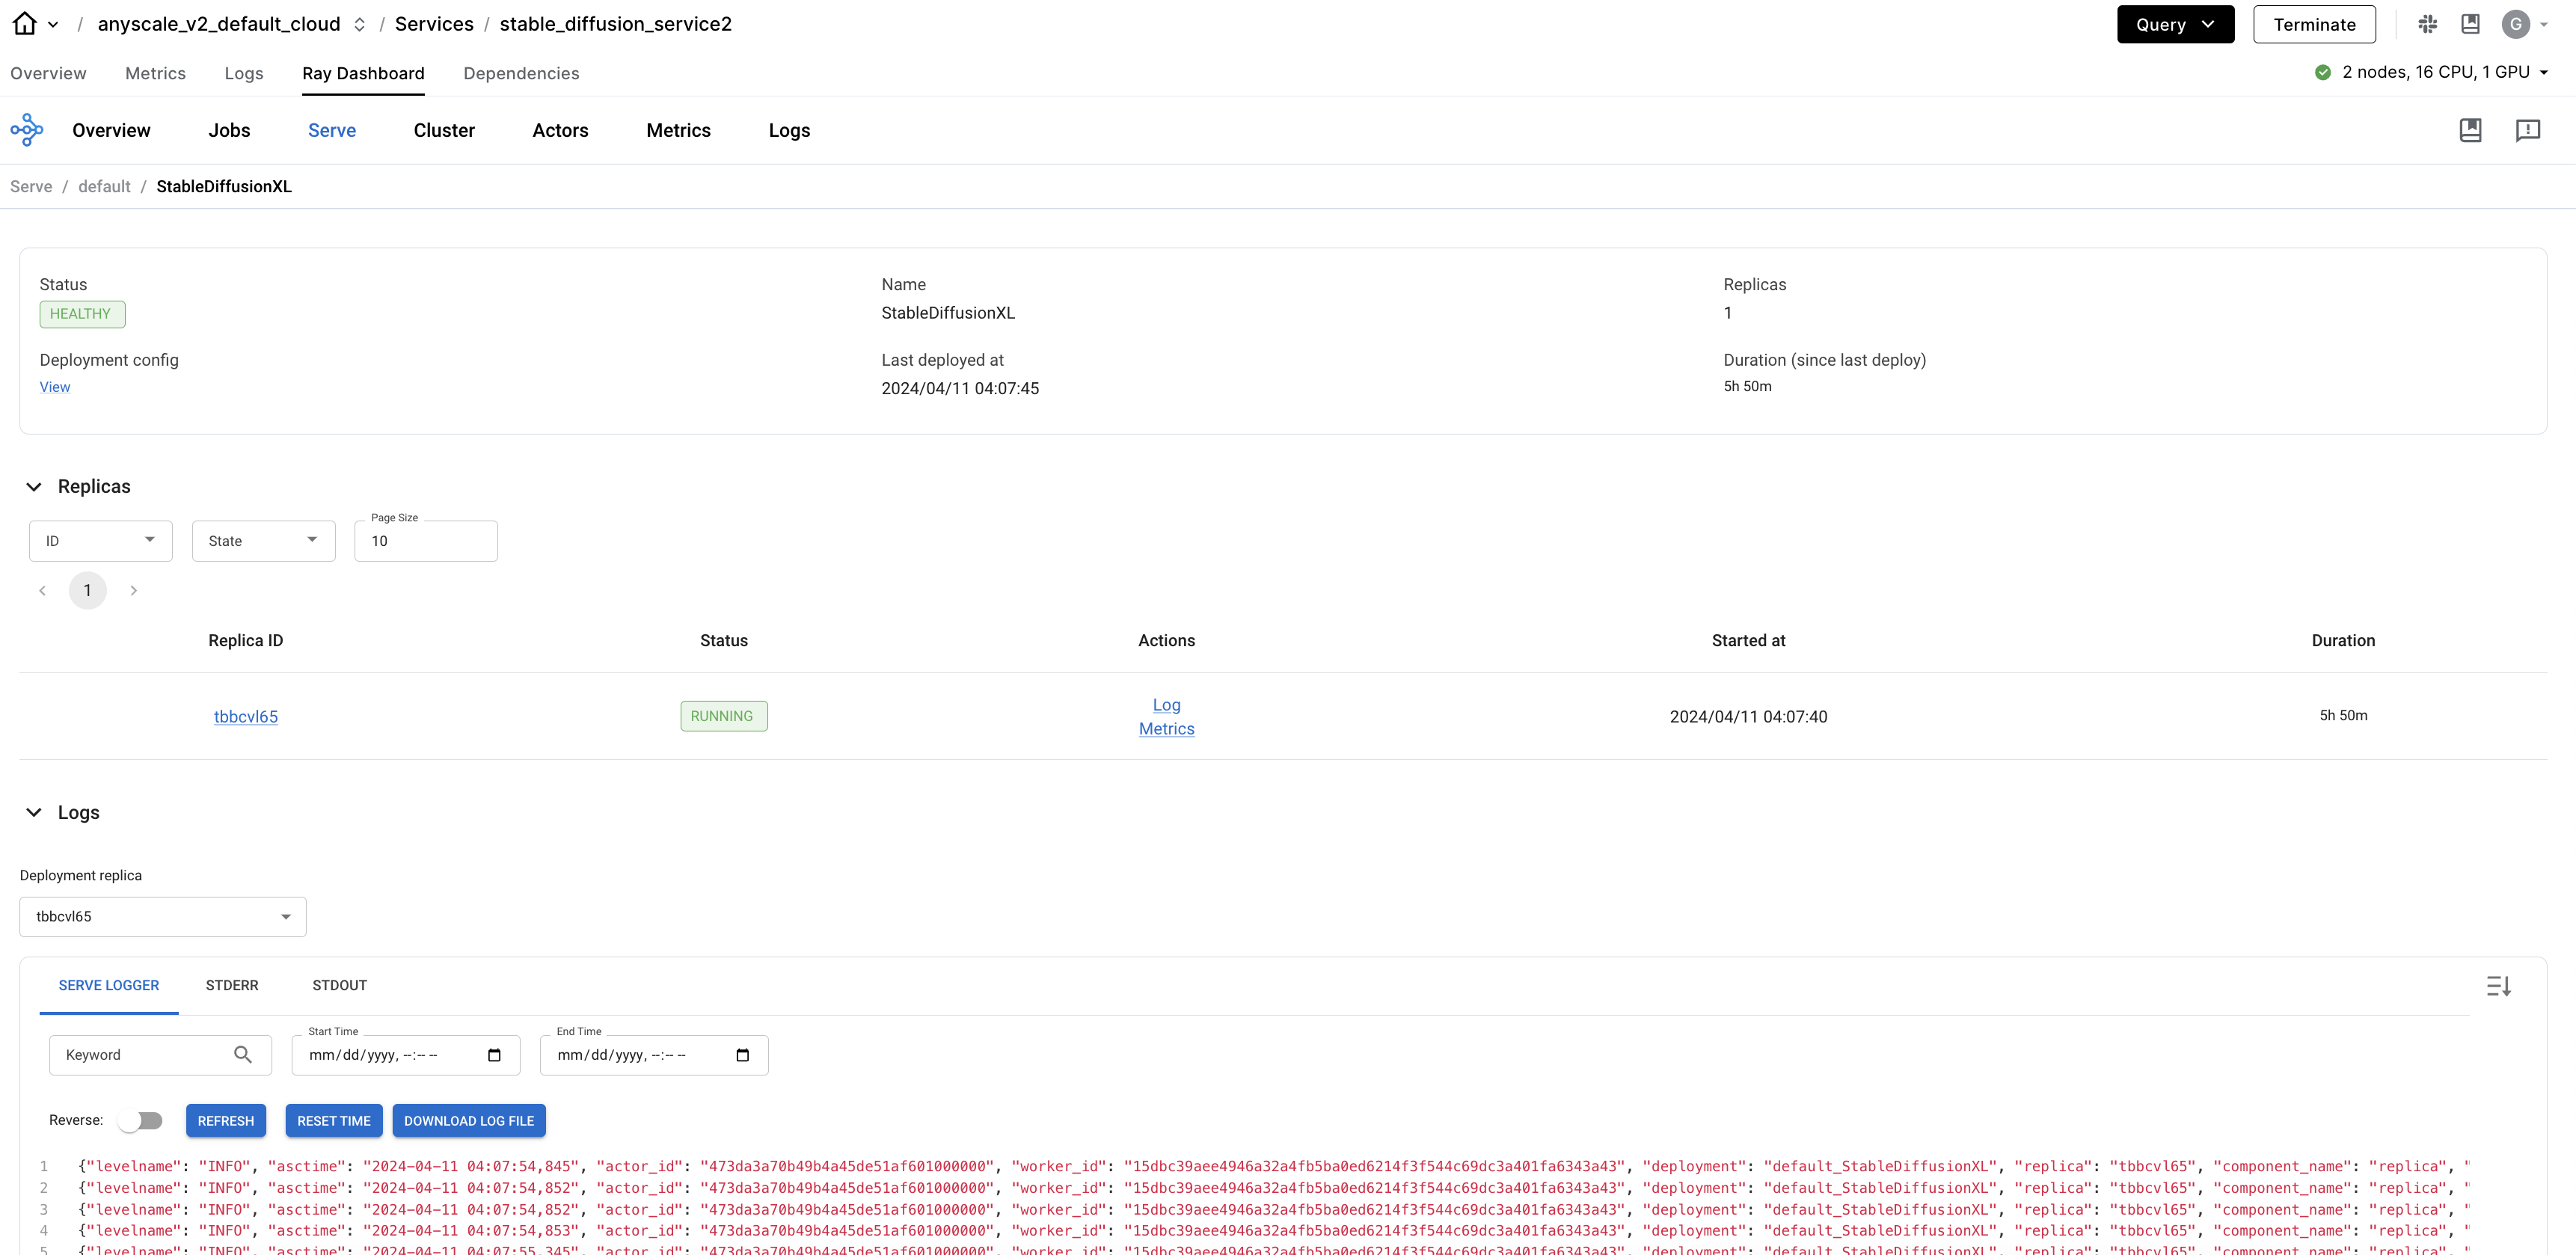
The Serve Application detail page shows the high level status of your Ray Serve app. It shows the number of deployments, replicas, and their statuses for the app. Click a replica to see more details about that replica, including its logs.
The Serve Replica detail page shows detailed information about the Serve Replica, including the logs, metrics, and a task history table. Use the task history table to see all the Ray tasks called on this replica and the logs associated with those Ray tasks.
Tracing
This feature is experimental, reach out with feedback or any issues encountered.
To help debug and monitor Serve applications, Ray integrates with OpenTelemetry to facilitate exporting traces to external tracing backends.
To learn more about how to add tracing into your Serve app, see the tracing guide.
Exporting logs and metrics
If you want to push logs to Vector, a tool to ship logs to Amazon CloudWatch, Google Cloud Monitoring, Datadog, or other observability tools, see Exporting logs and metrics with Vector.
More info
- To learn more about monitoring Serve applications, see the Serve monitoring documentation
- To learn more about Grafana and how to use it, see the official Grafana documentation
- To learn more about the metrics that Ray Serve emits, see the Serve Metrics documentation
- To learn more details about the Ray Dashboard, see the Ray Dashboard documentation
- Custom metrics can be added to your applications. To learn more, see the Ray Custom Metrics documentation. To visualize these metrics, you can add them to a Grafana dashboard.