Observability and tracking
Observability and tracking
This guide uses LlamaFactory as an example framework. Anyscale supports multiple frameworks for LLM post-training. See Choose a framework for LLM post-training.
This guide teaches you how to integrate with experiment tracking libraries and Ray's observability tools to monitor your LLM post-training using LLaMA-Factory on Anyscale.
Integrate with experiment tracking libraries
For post-training experiments, you often need a specialized tool to log metrics, compare runs, and manage artifacts. LLaMA-Factory integrates seamlessly with popular libraries such as W&B, TensorBoard, and MLflow.
In a LLaMA-Factory post-training config:
# qwen_lora_sft.yaml
### output
output_dir: qwen_lora_sft   # This becomes the run name.
logging_steps: 5
save_steps: 50
plot_loss: true
report_to: [wandb, tensorboard, mlflow]  # Pick one or multiple trackers, or set to none to disable.

### Training
num_train_epochs: 3
per_device_train_batch_size: 2
gradient_accumulation_steps: 4

### Ray
ray_num_workers: 4
ray_init_kwargs:
  runtime_env:
    env_vars:
      # Set up API tokens as environment variables here.
      # WANDB_API_KEY: <your_wandb_token>
      # MLFLOW_TRACKING_TOKEN=<mlflow_tracking_token>
      # MLFLOW_TRACKING_URI=https://<your_cloud_id>.cloud.databricks.com
      # MLFLOW_EXPERIMENT_NAME=/Users/<your_user_id>/experiment_name
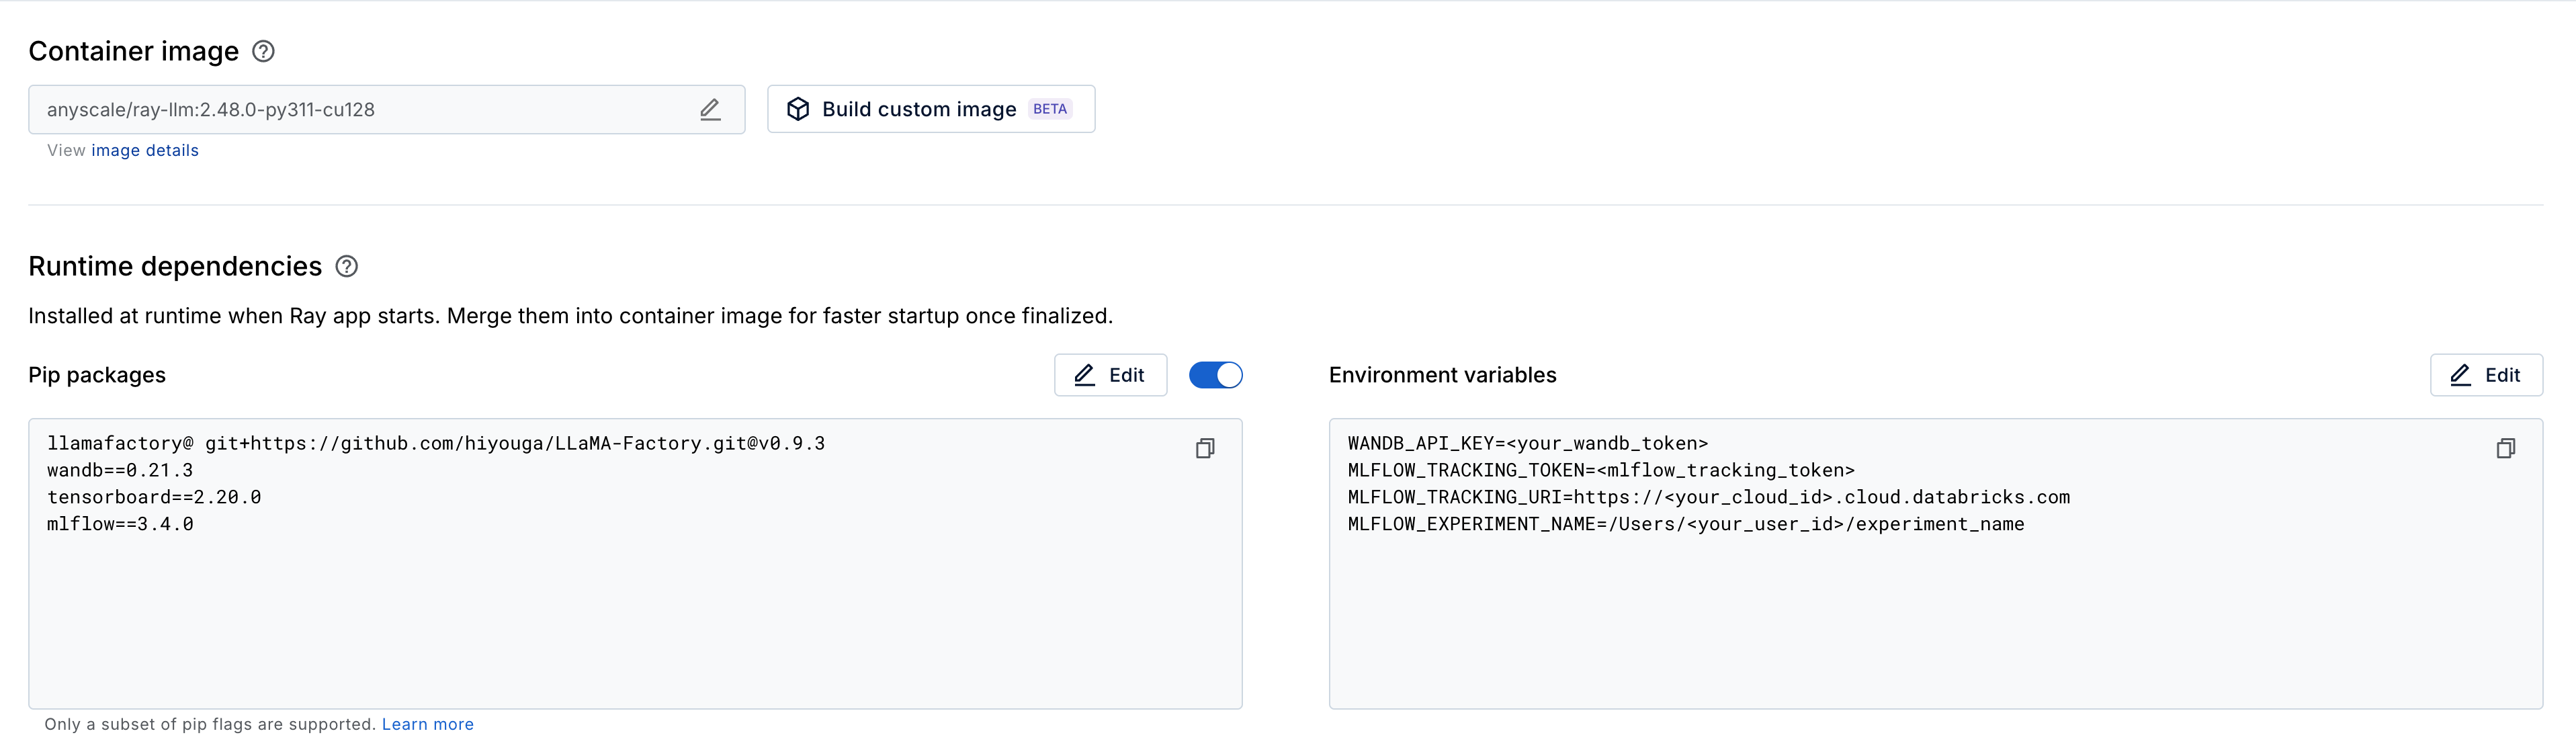
report_to: Choose trackers to log to. Pass a list (for example,[wandb, tensorboard]) for multiple trackers, ornoneto disable. If you omit this parameter, LLaMA-Factory tries all installed trackers, which can cause errors if required environment variables aren't set.env_vars: Specify environment variables for experiment tracking libraries such as W&B and MLflow. Alternatively, if you don't define them here, you need to set them up manually in your Anyscale workspace. Add variables such asWANDB_API_KEYorMLFLOW_TRACKING_TOKENat Workspace > Dependencies > Environment variables as shown here.
Understand logging_steps and save_steps
Parameters such as logging_steps and save_steps control how often actions occur during training:
logging_steps: Controls how often Ray Train logs training metrics (such as loss).save_steps: Controls how often Ray Train saves a model checkpoint.
For more details on how a step is defined, see Save by step.
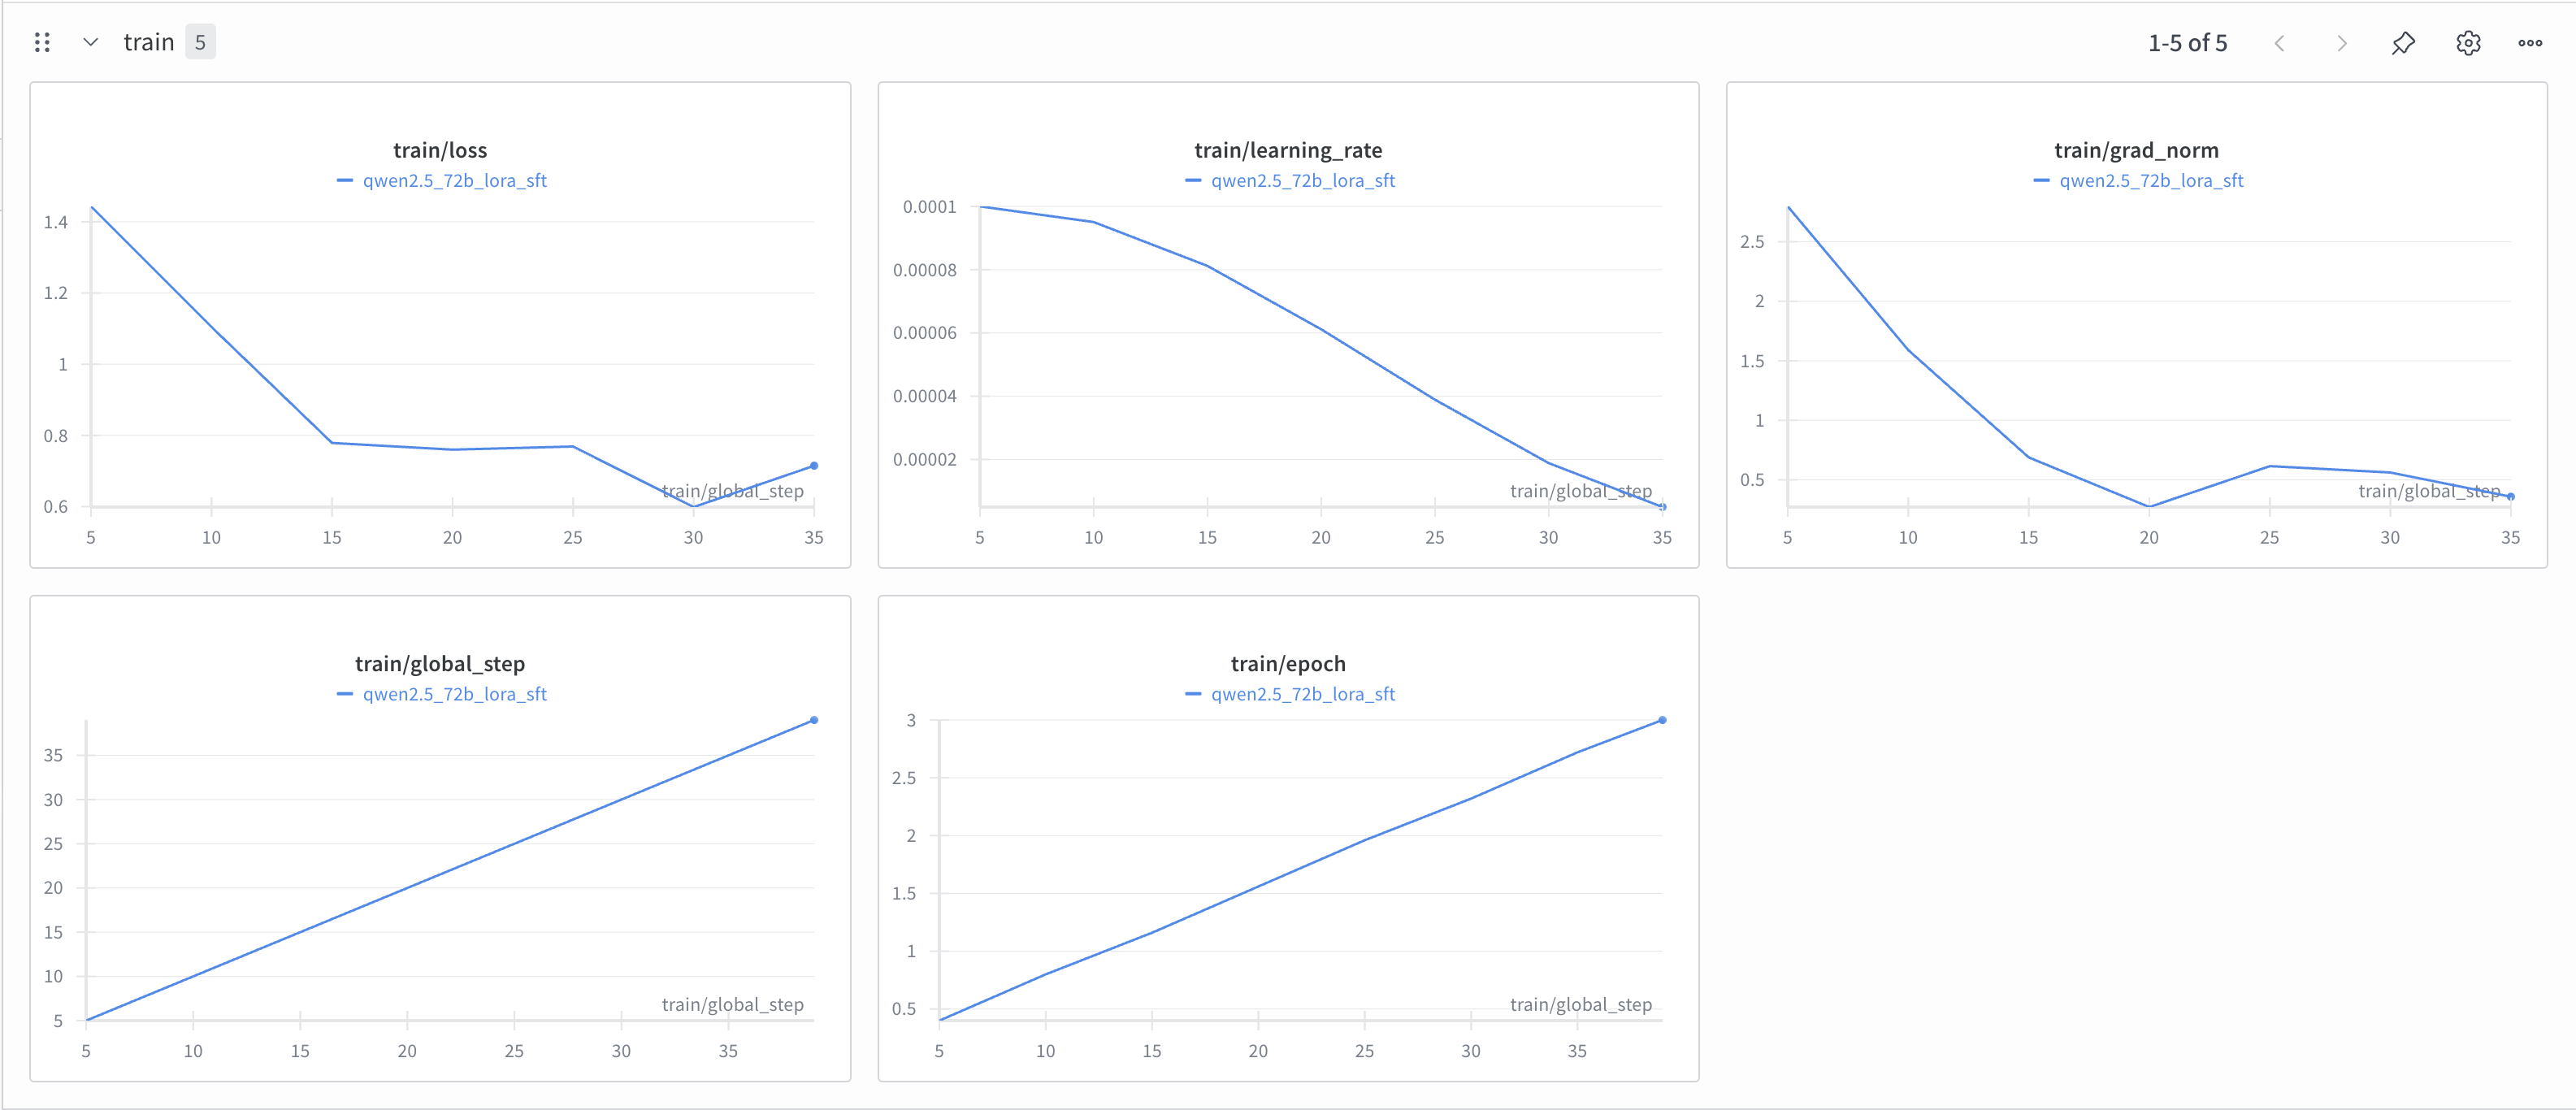
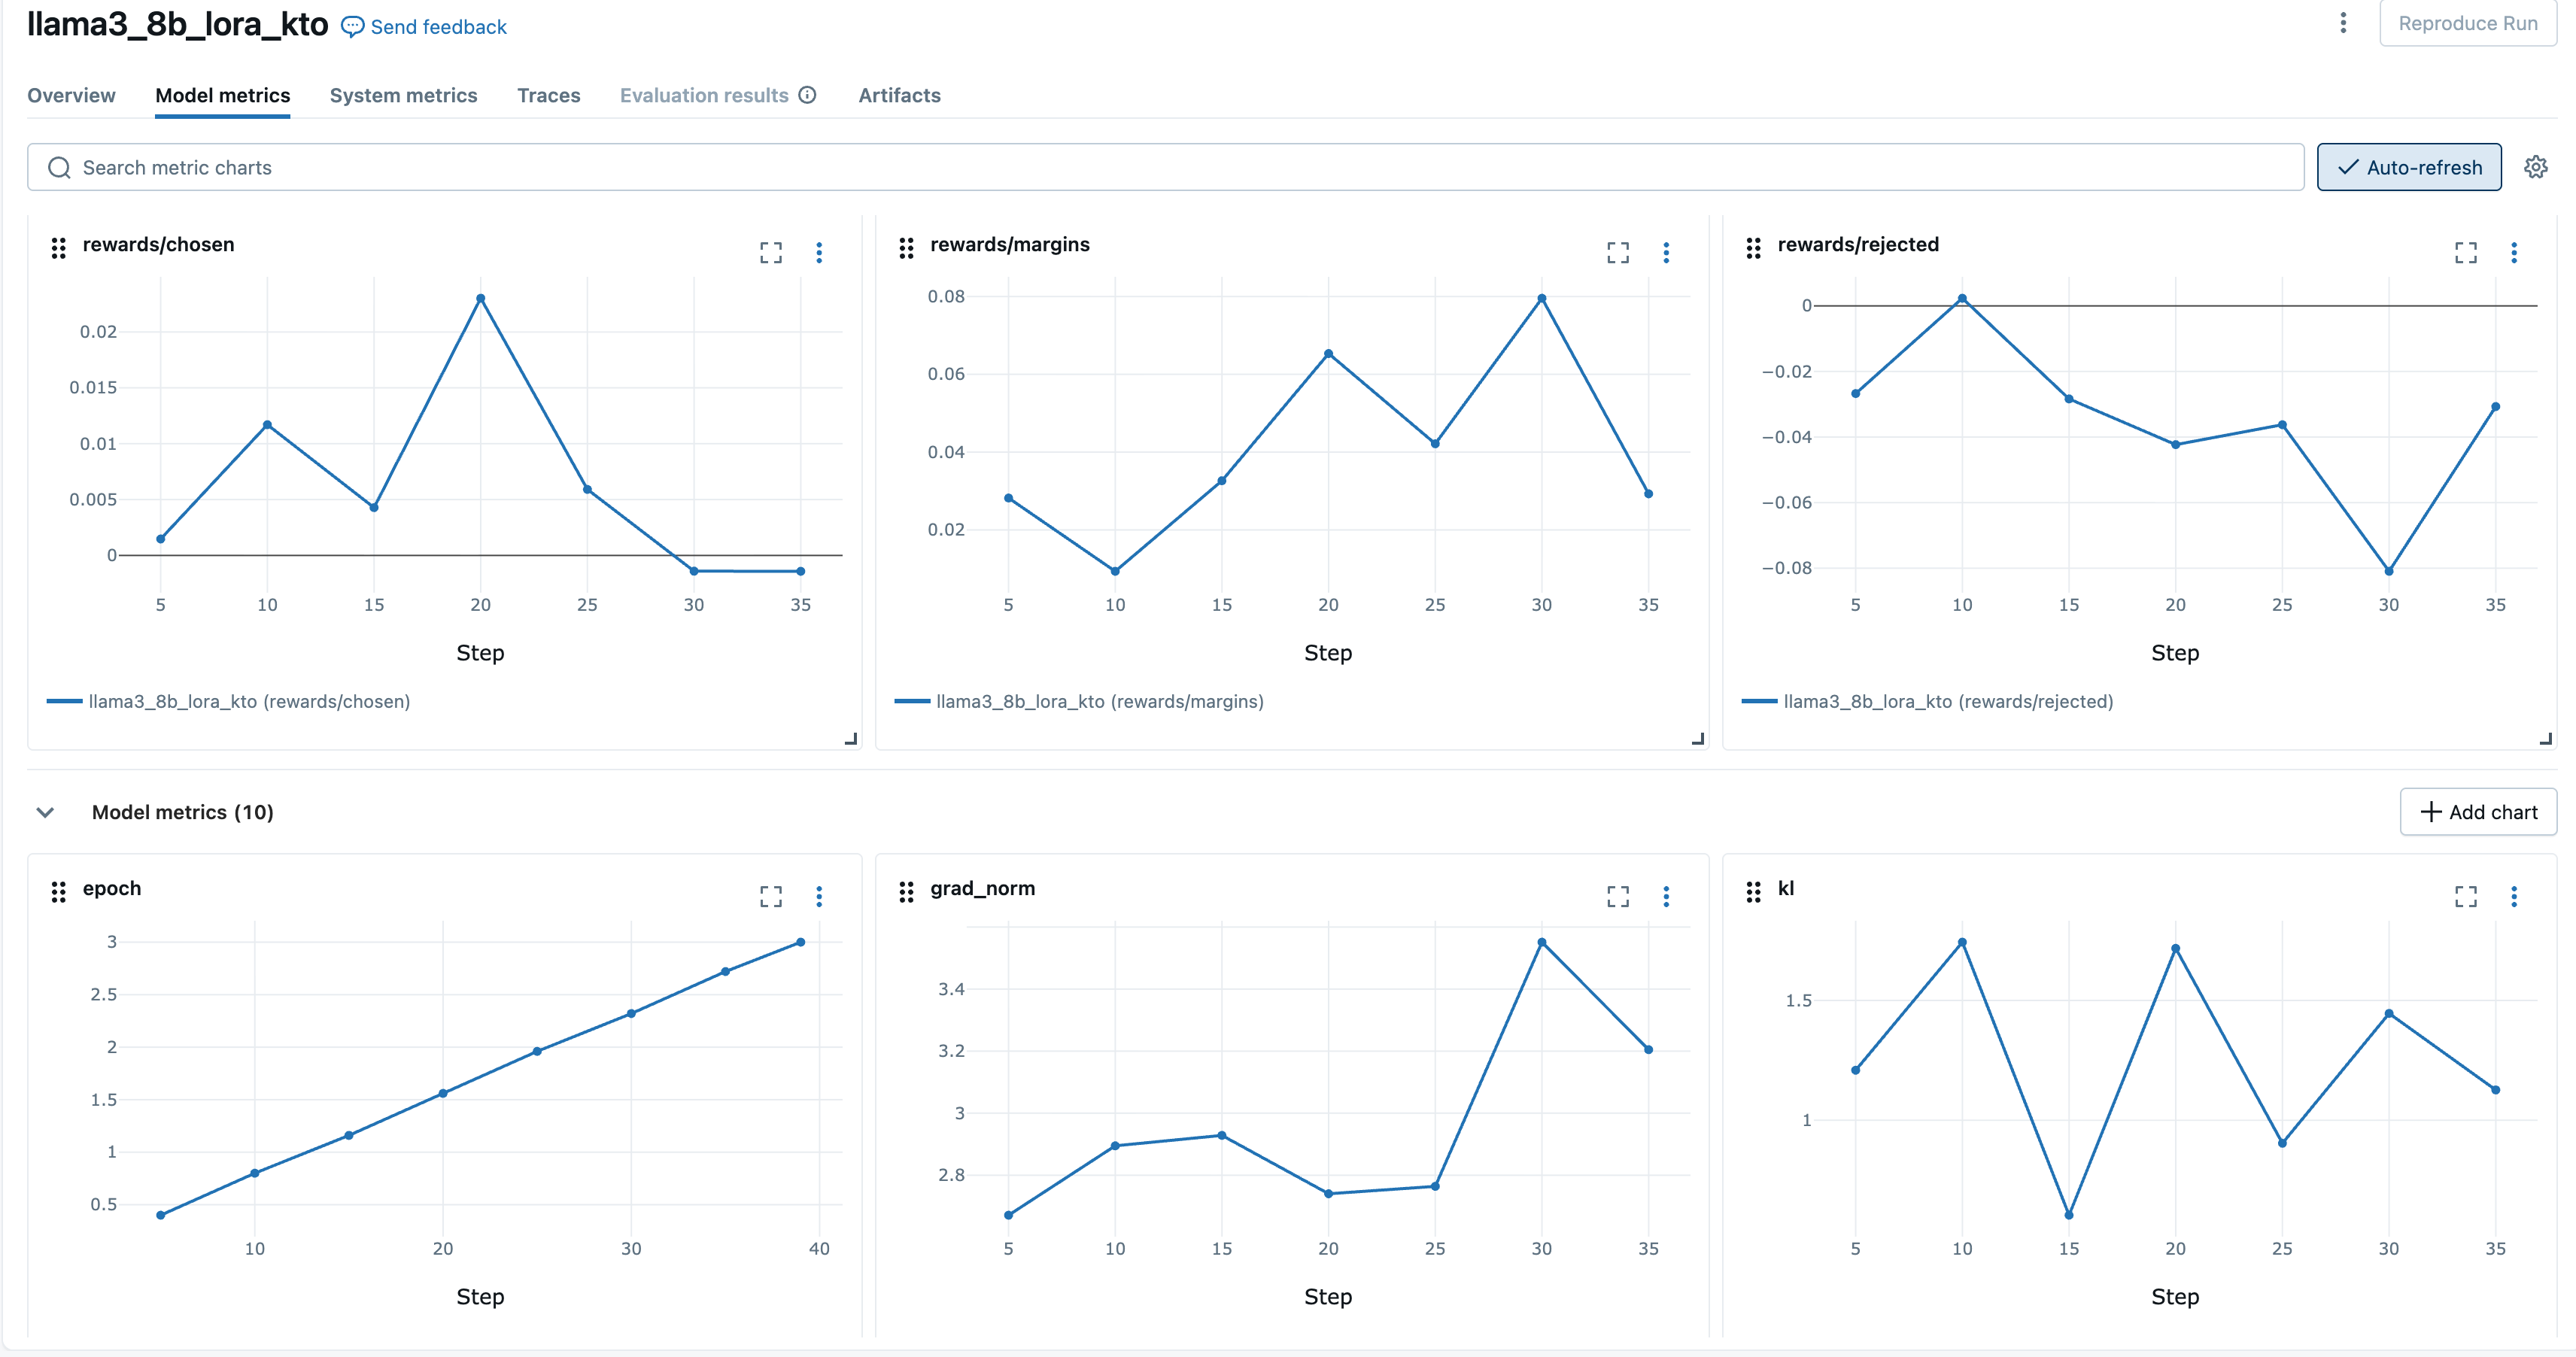
Track with Weights & Biases (W&B)
Install Weights & Biases:
pip install wandb
After installing, add WANDB_API_KEY as an environment variable as mentioned above. You can find the key on your Weights & Biases account > API keys.
Track with TensorBoard
Choose TensorBoard when you need a simple solution for visualizing training runs without an external service.
-
When the job is running: LLaMA-Factory prints a ready-to-run command that starts with
tensorboard --logdir. Open a new terminal and run it, for example:tensorboard --logdir /tmp/ray/session_2025-09-09_10-09-51_355612_2399/artifacts/2025-09-09_15-11-53/qwen2.5_32b_lora_sft/driver_artifacts -
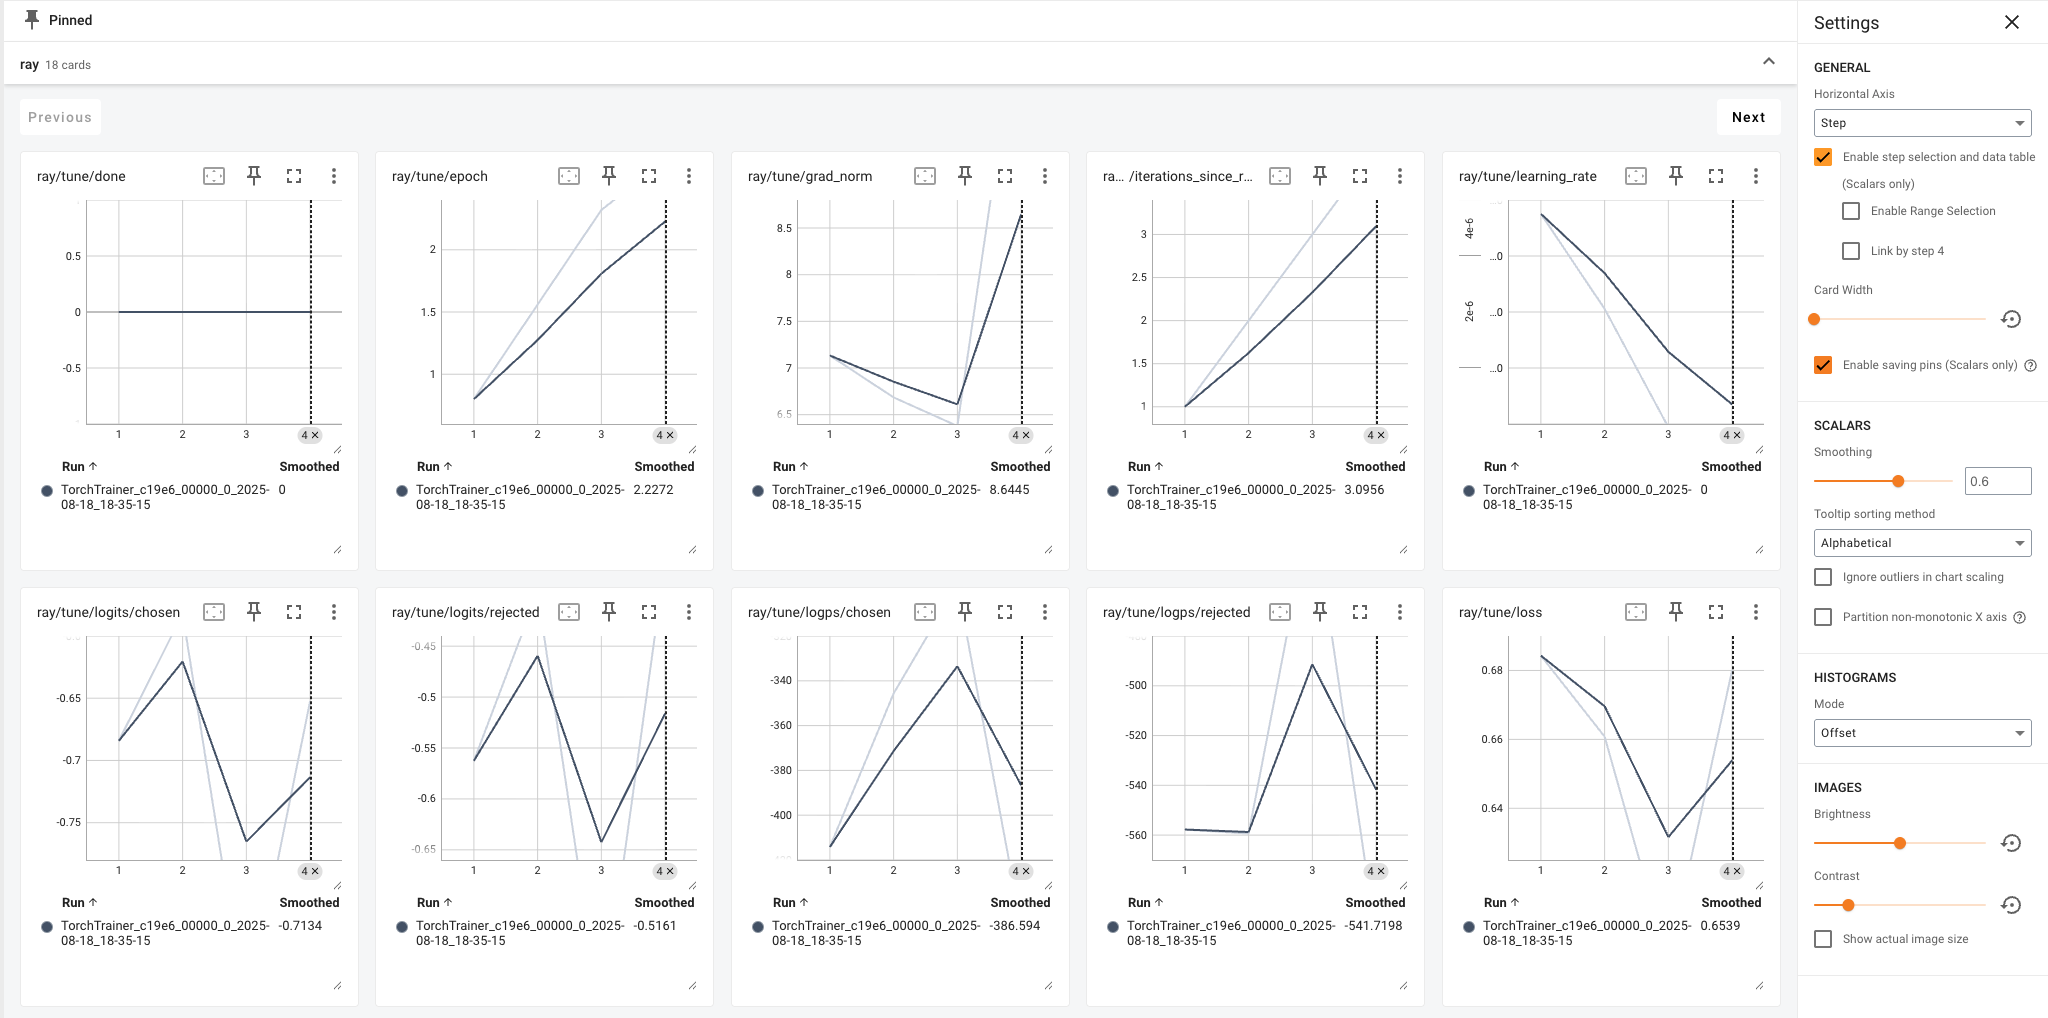
After the job (shared storage): Point TensorBoard at
{ray_storage_path}/{ray_run_name}/. Each subfolder such asTorchTrainer_8c6a5_00000_0_2025-09-09_09-53-45/represents a single run and contains its TensorBoard event files. By using the parentqwen2.5_32b_lora_sftas--logdir, TensorBoard automatically discovers allTorchTrainer_x/runs inside and shows them together for comparison.
Example:
tensorboard --logdir /mnt/cluster_storage/qwen2.5_32b_lora_sft
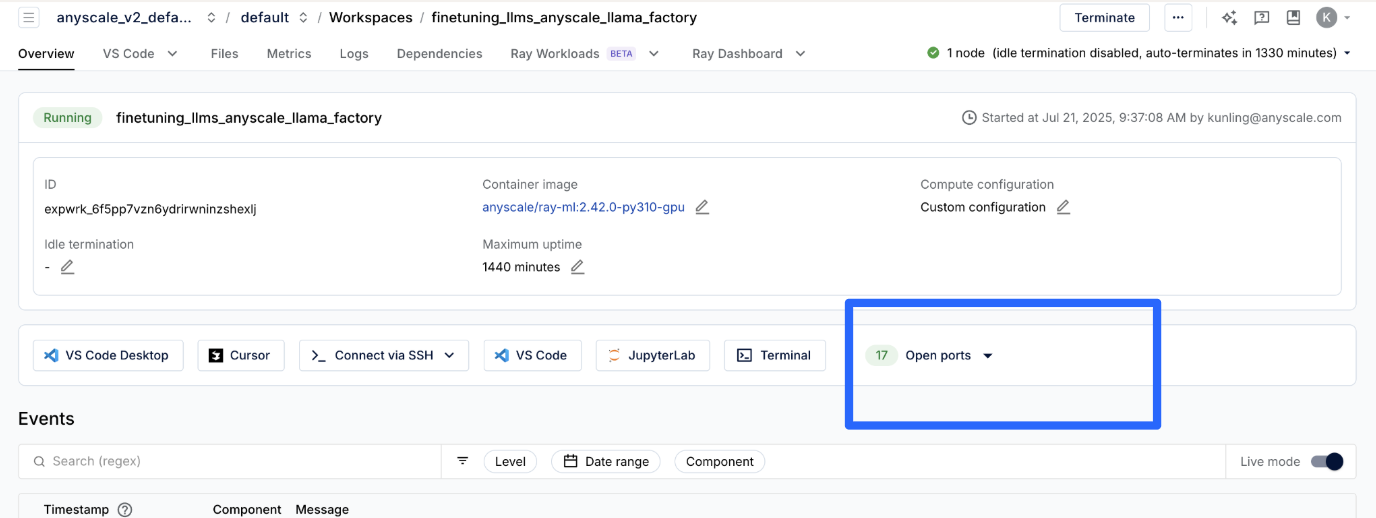
You can find the corresponding open port 6006 with description TensorBoard to visualize the graphs:
Track with MLflow
Install MLflow:
pip install mlflow
After installing, add MLFLOW_TRACKING_TOKEN, MLFLOW_TRACKING_URI, and MLFLOW_EXPERIMENT_NAME as environment variables as mentioned above.
Create a managed hosting account on MLflow. Find the TOKEN under your Account > Settings > Developer and the URI from the web console URI that usually starts with dbc-.
Monitor post-training and fine-tuning on Anyscale
After you set up experiment tracking (W&B, TensorBoard, or MLflow), use Anyscale's workspace-level observability to see what's happening on the cluster itself in real time without changing the training code.
- Ray session directory: This directory (
/tmp/ray/session_<...>) contains detailed logs for every process, metric snapshots, and other diagnostic information. - Ray dashboard: A web UI that provides a real-time overview of the cluster's health, resource utilization, and job status.
Ray Grafana dashboards
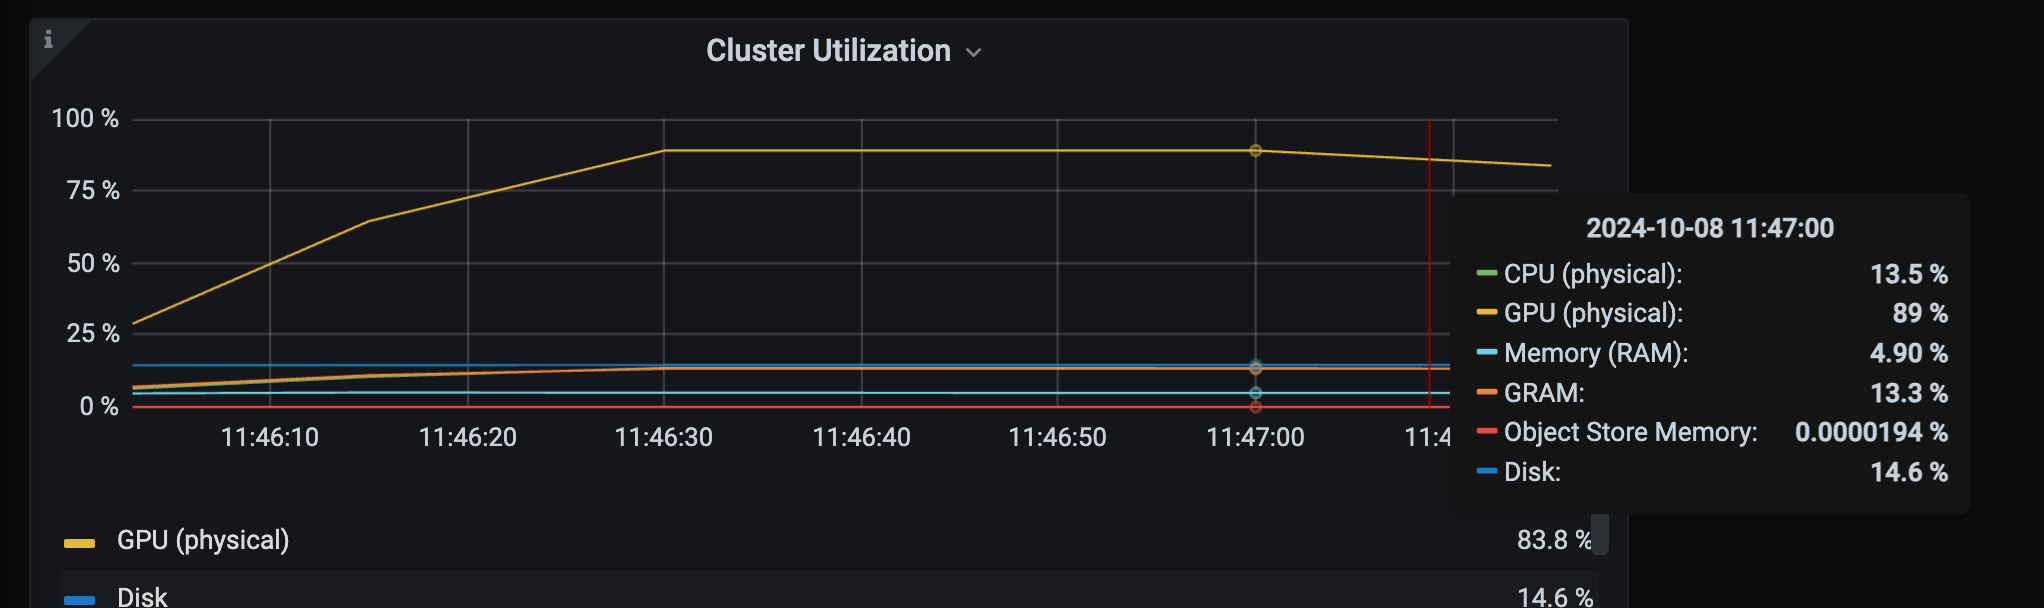
Use the Ray Dashboard > Metrics tab to watch the cluster while training:
-
Cluster overview: Overall cluster health and high-level utilization.
-
GPU utilization (with related disk activity): Track GPU busy time alongside disk I/O if your workload downloads or prepares data locally.
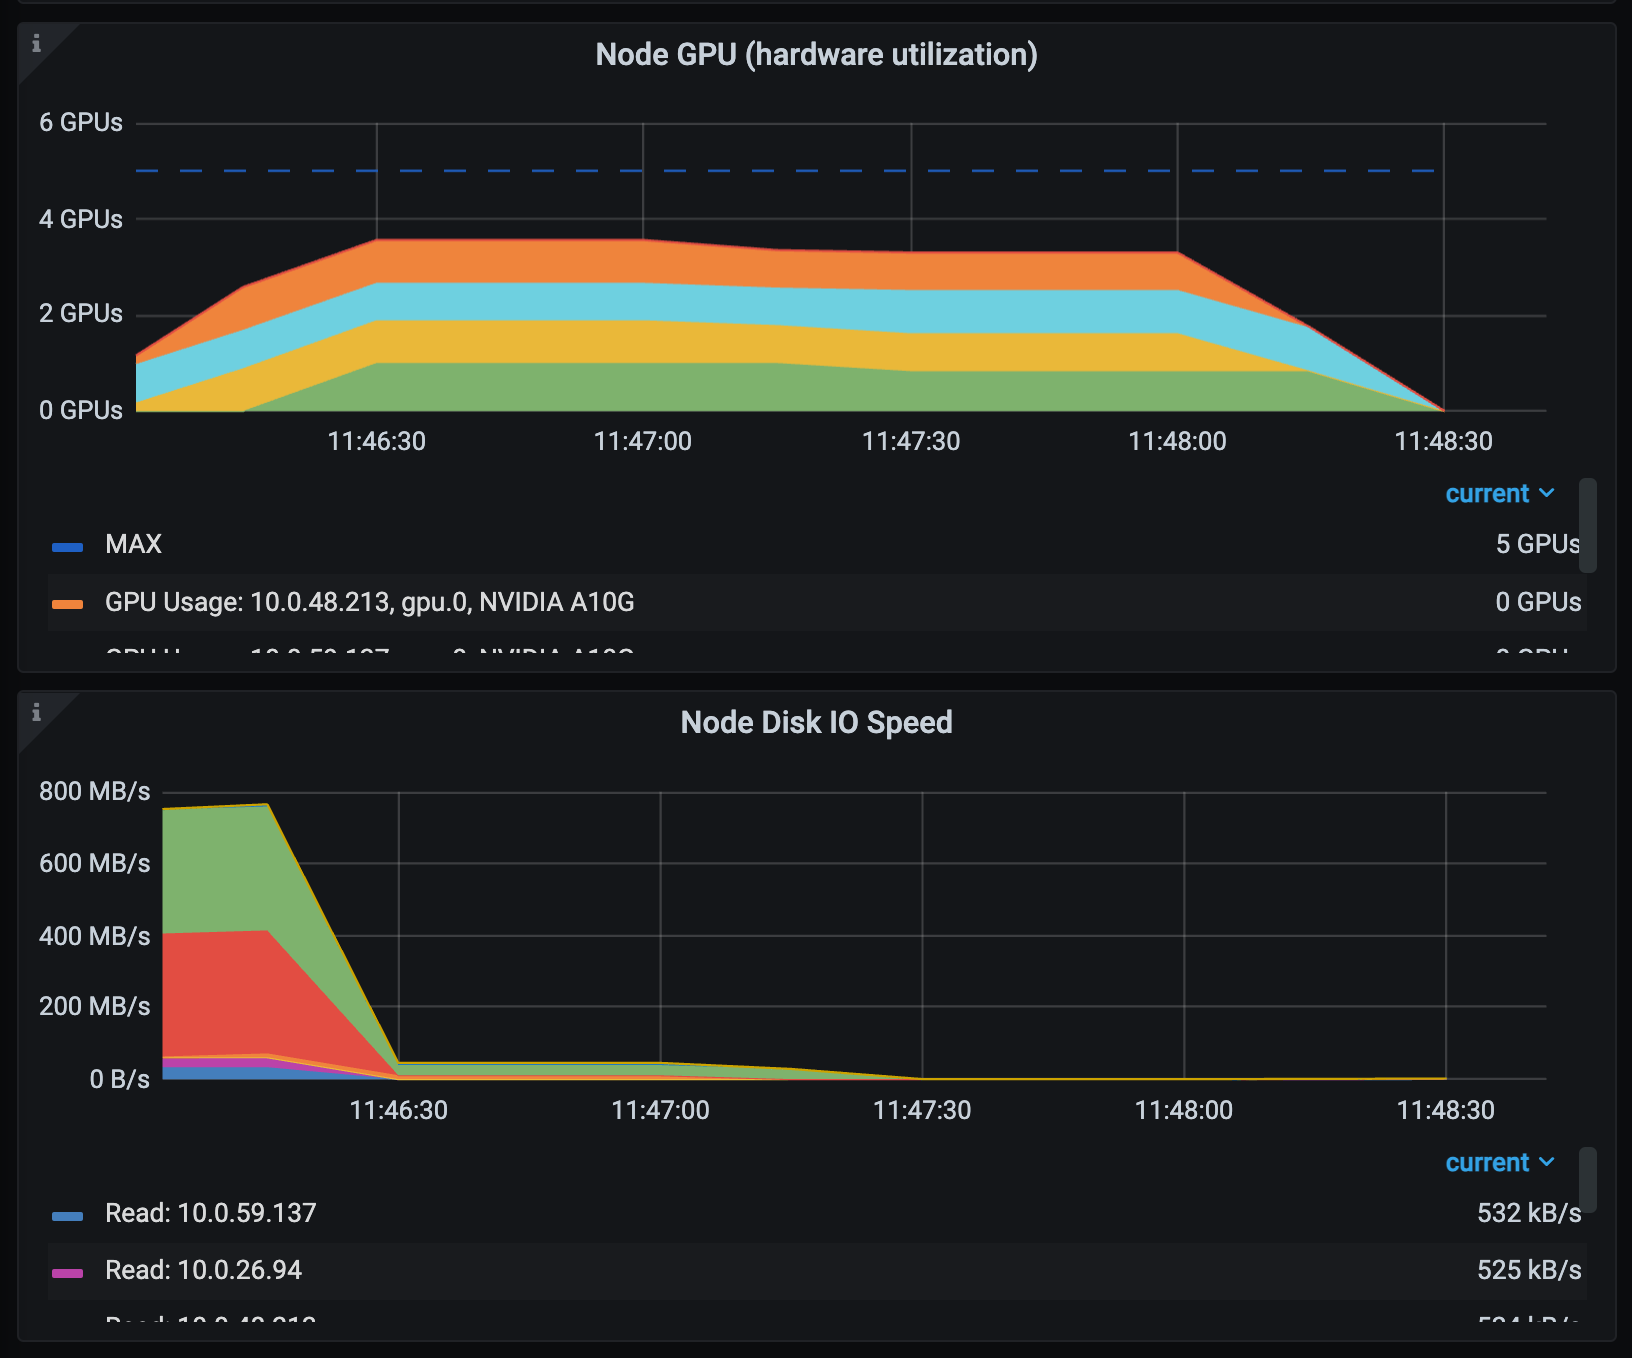
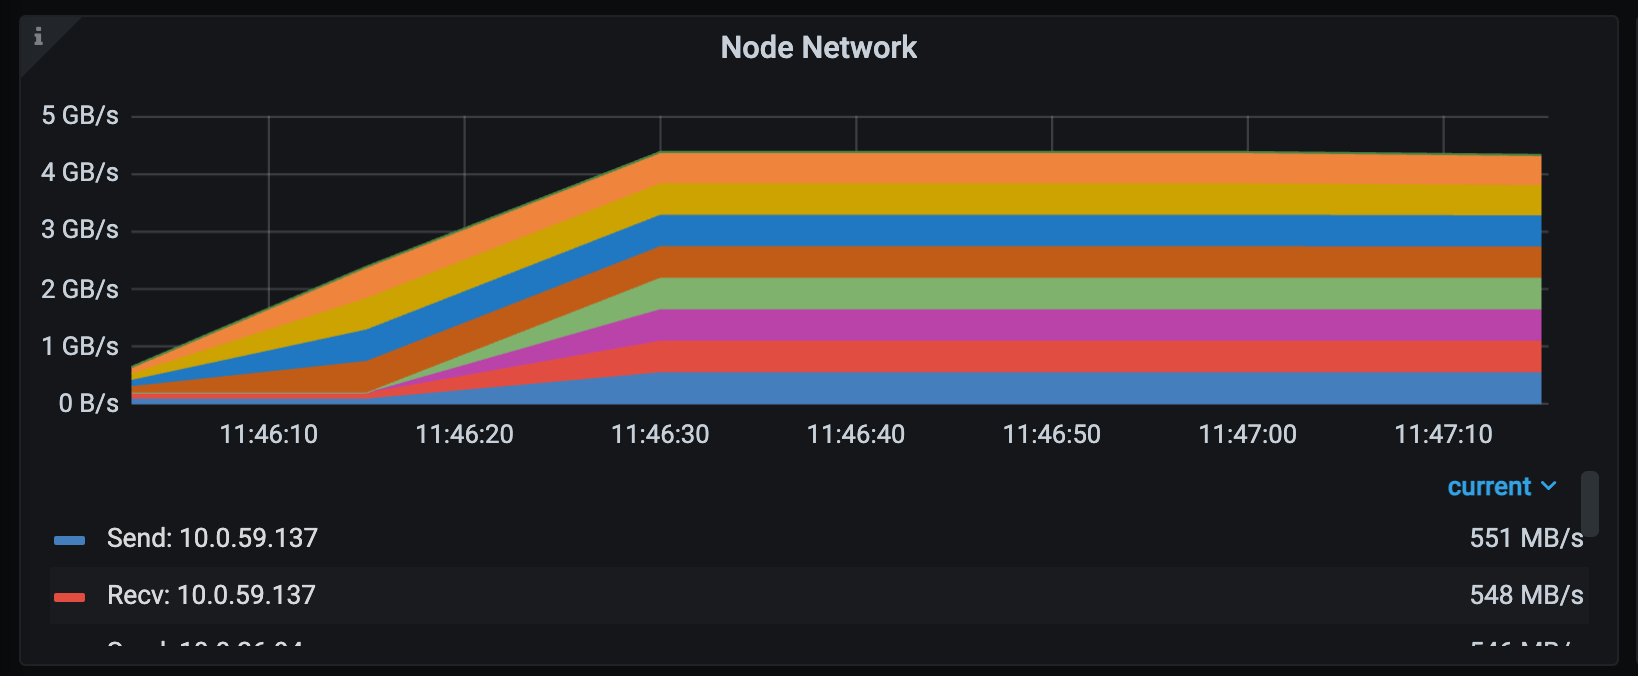
-
Cluster network I/O: Helpful when input pipelines or shuffles move data between nodes.
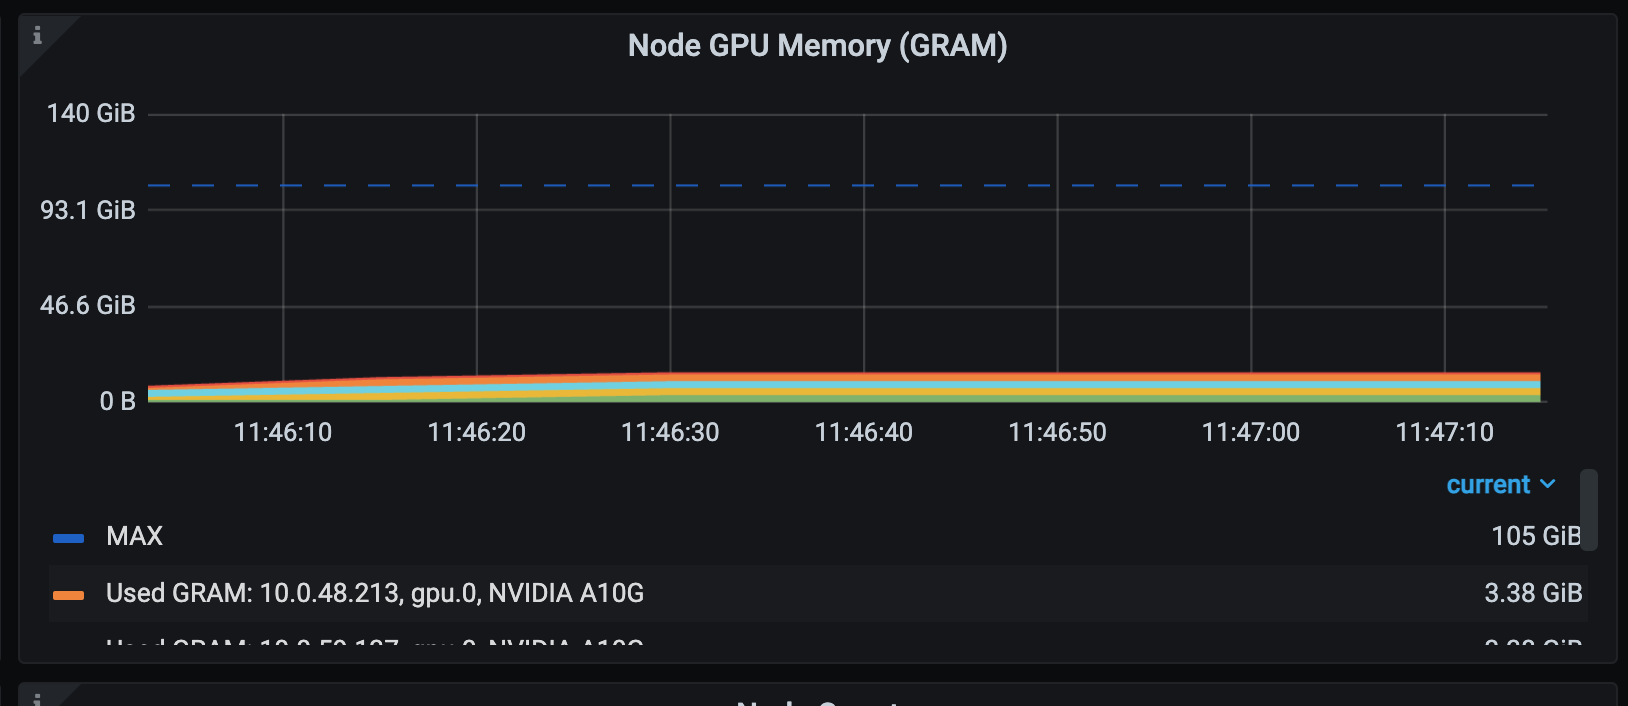
-
GPU memory and auxiliary resources: Inspect VRAM usage alongside CPU and RAM utilization.
Use this page for a fast sanity check (resources available versus resources used) while a job runs.
Ray Train dashboard
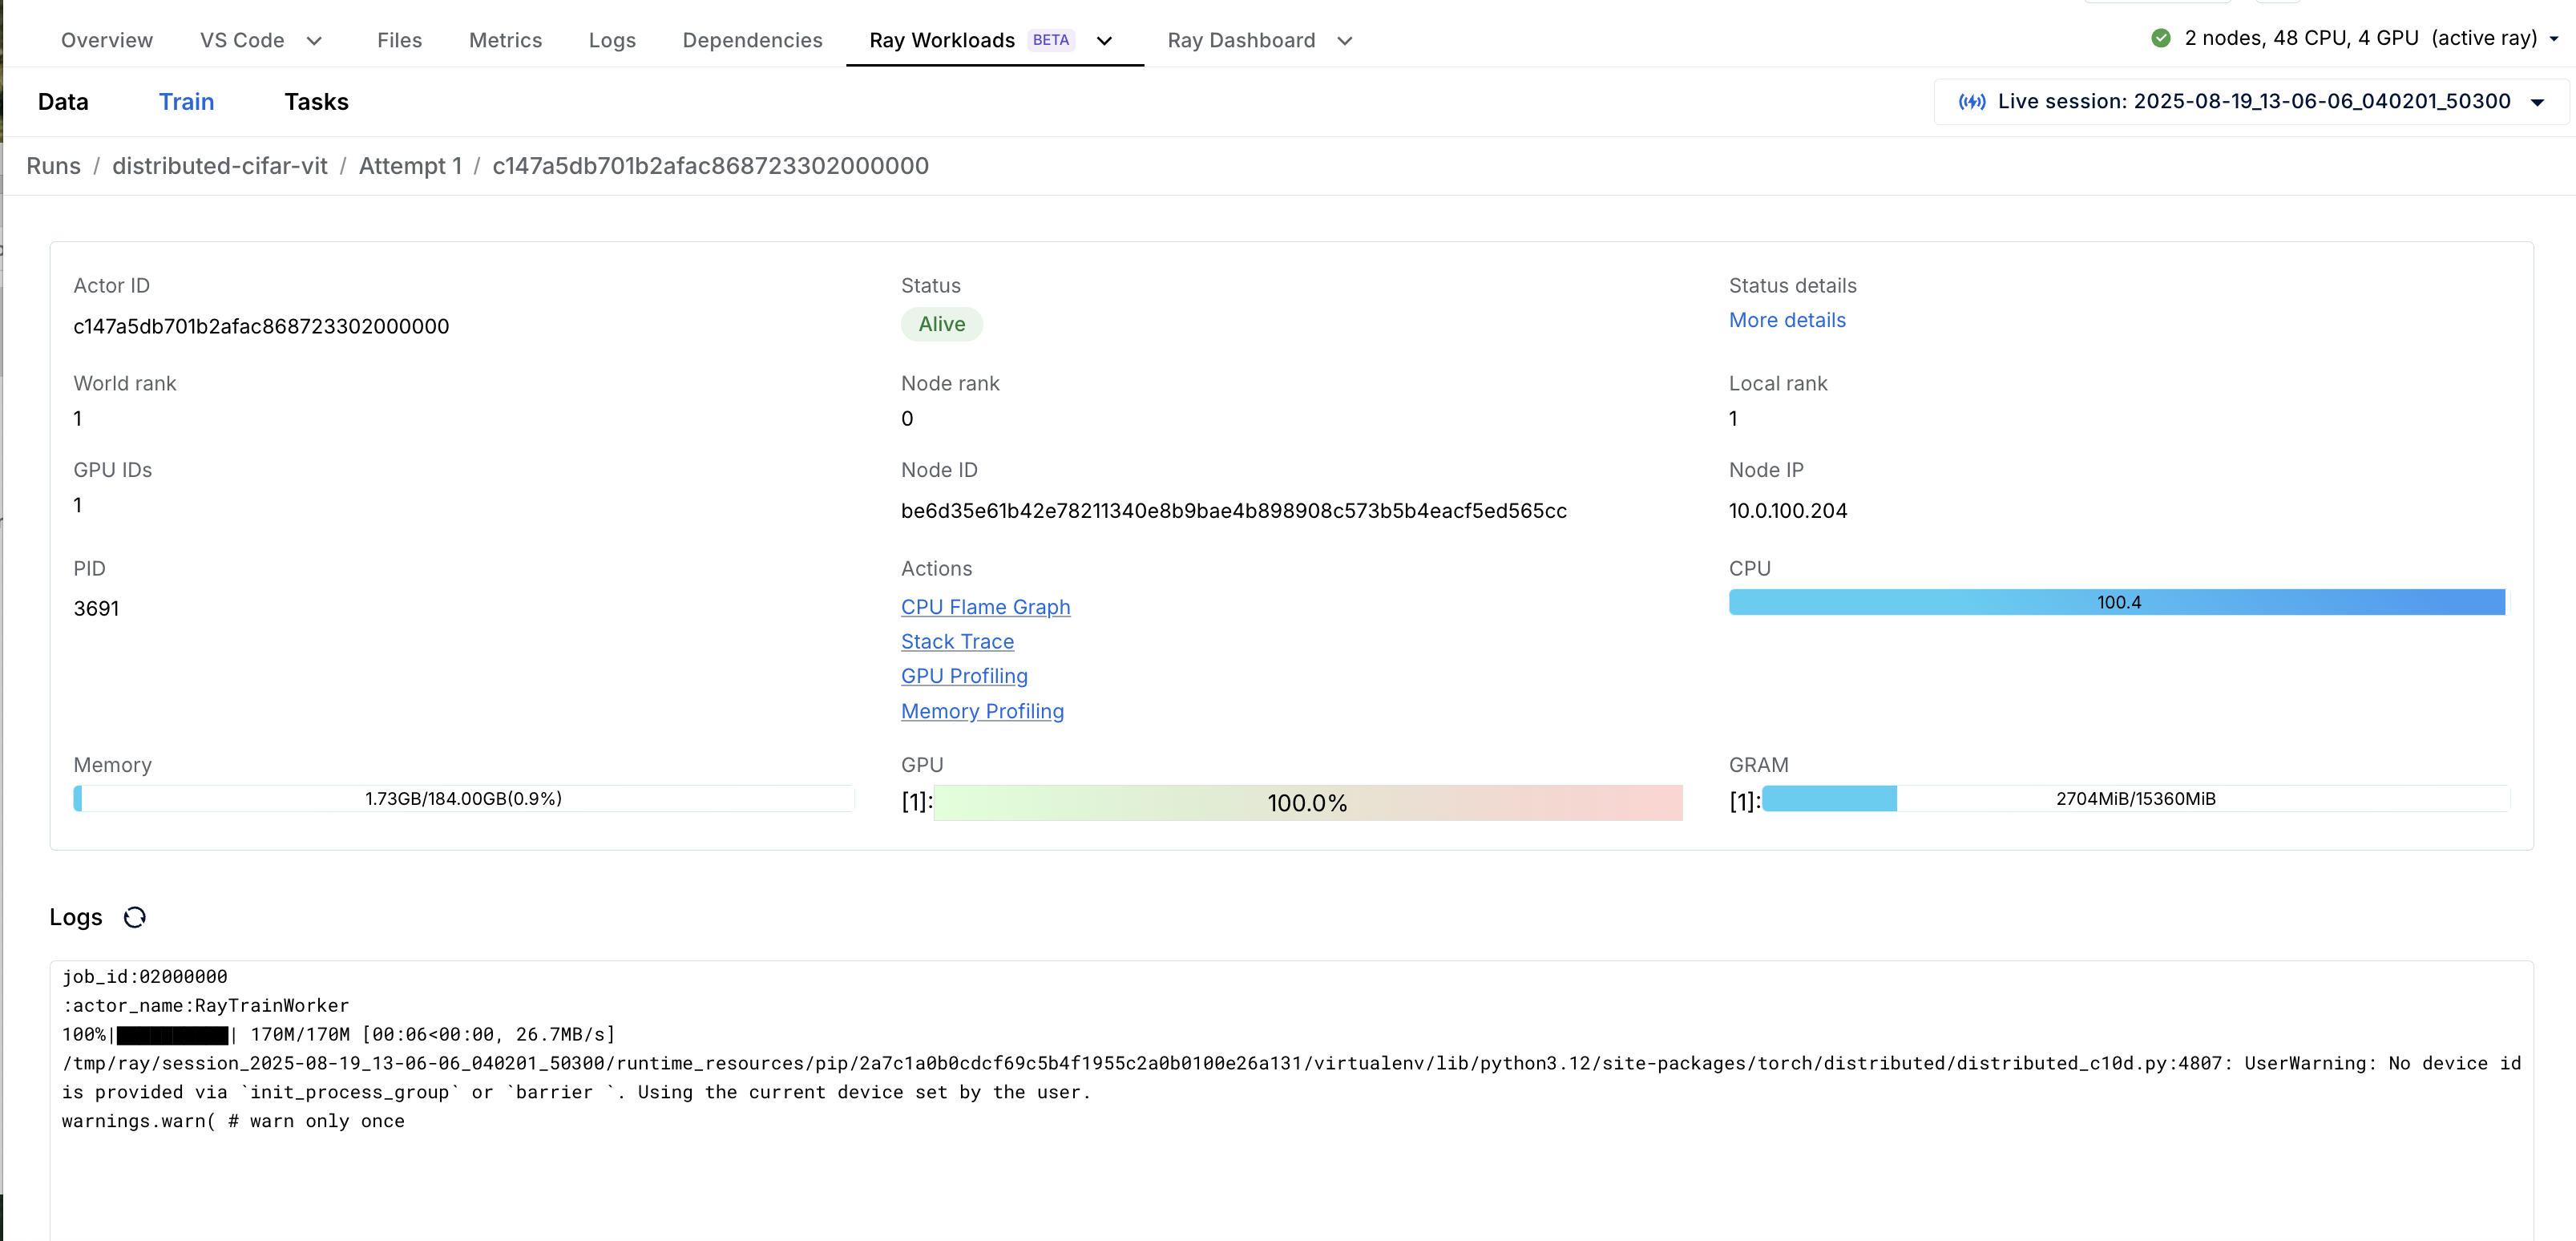
The Ray Train dashboard under Ray Workloads provides deeper, training-aware inspection:
-
Overview: High-level view of Ray Train runs. This view helps debug failed or flaky training runs. You can quickly spot where a run stopped, check errors, and correlate failures with metrics or timeline events.
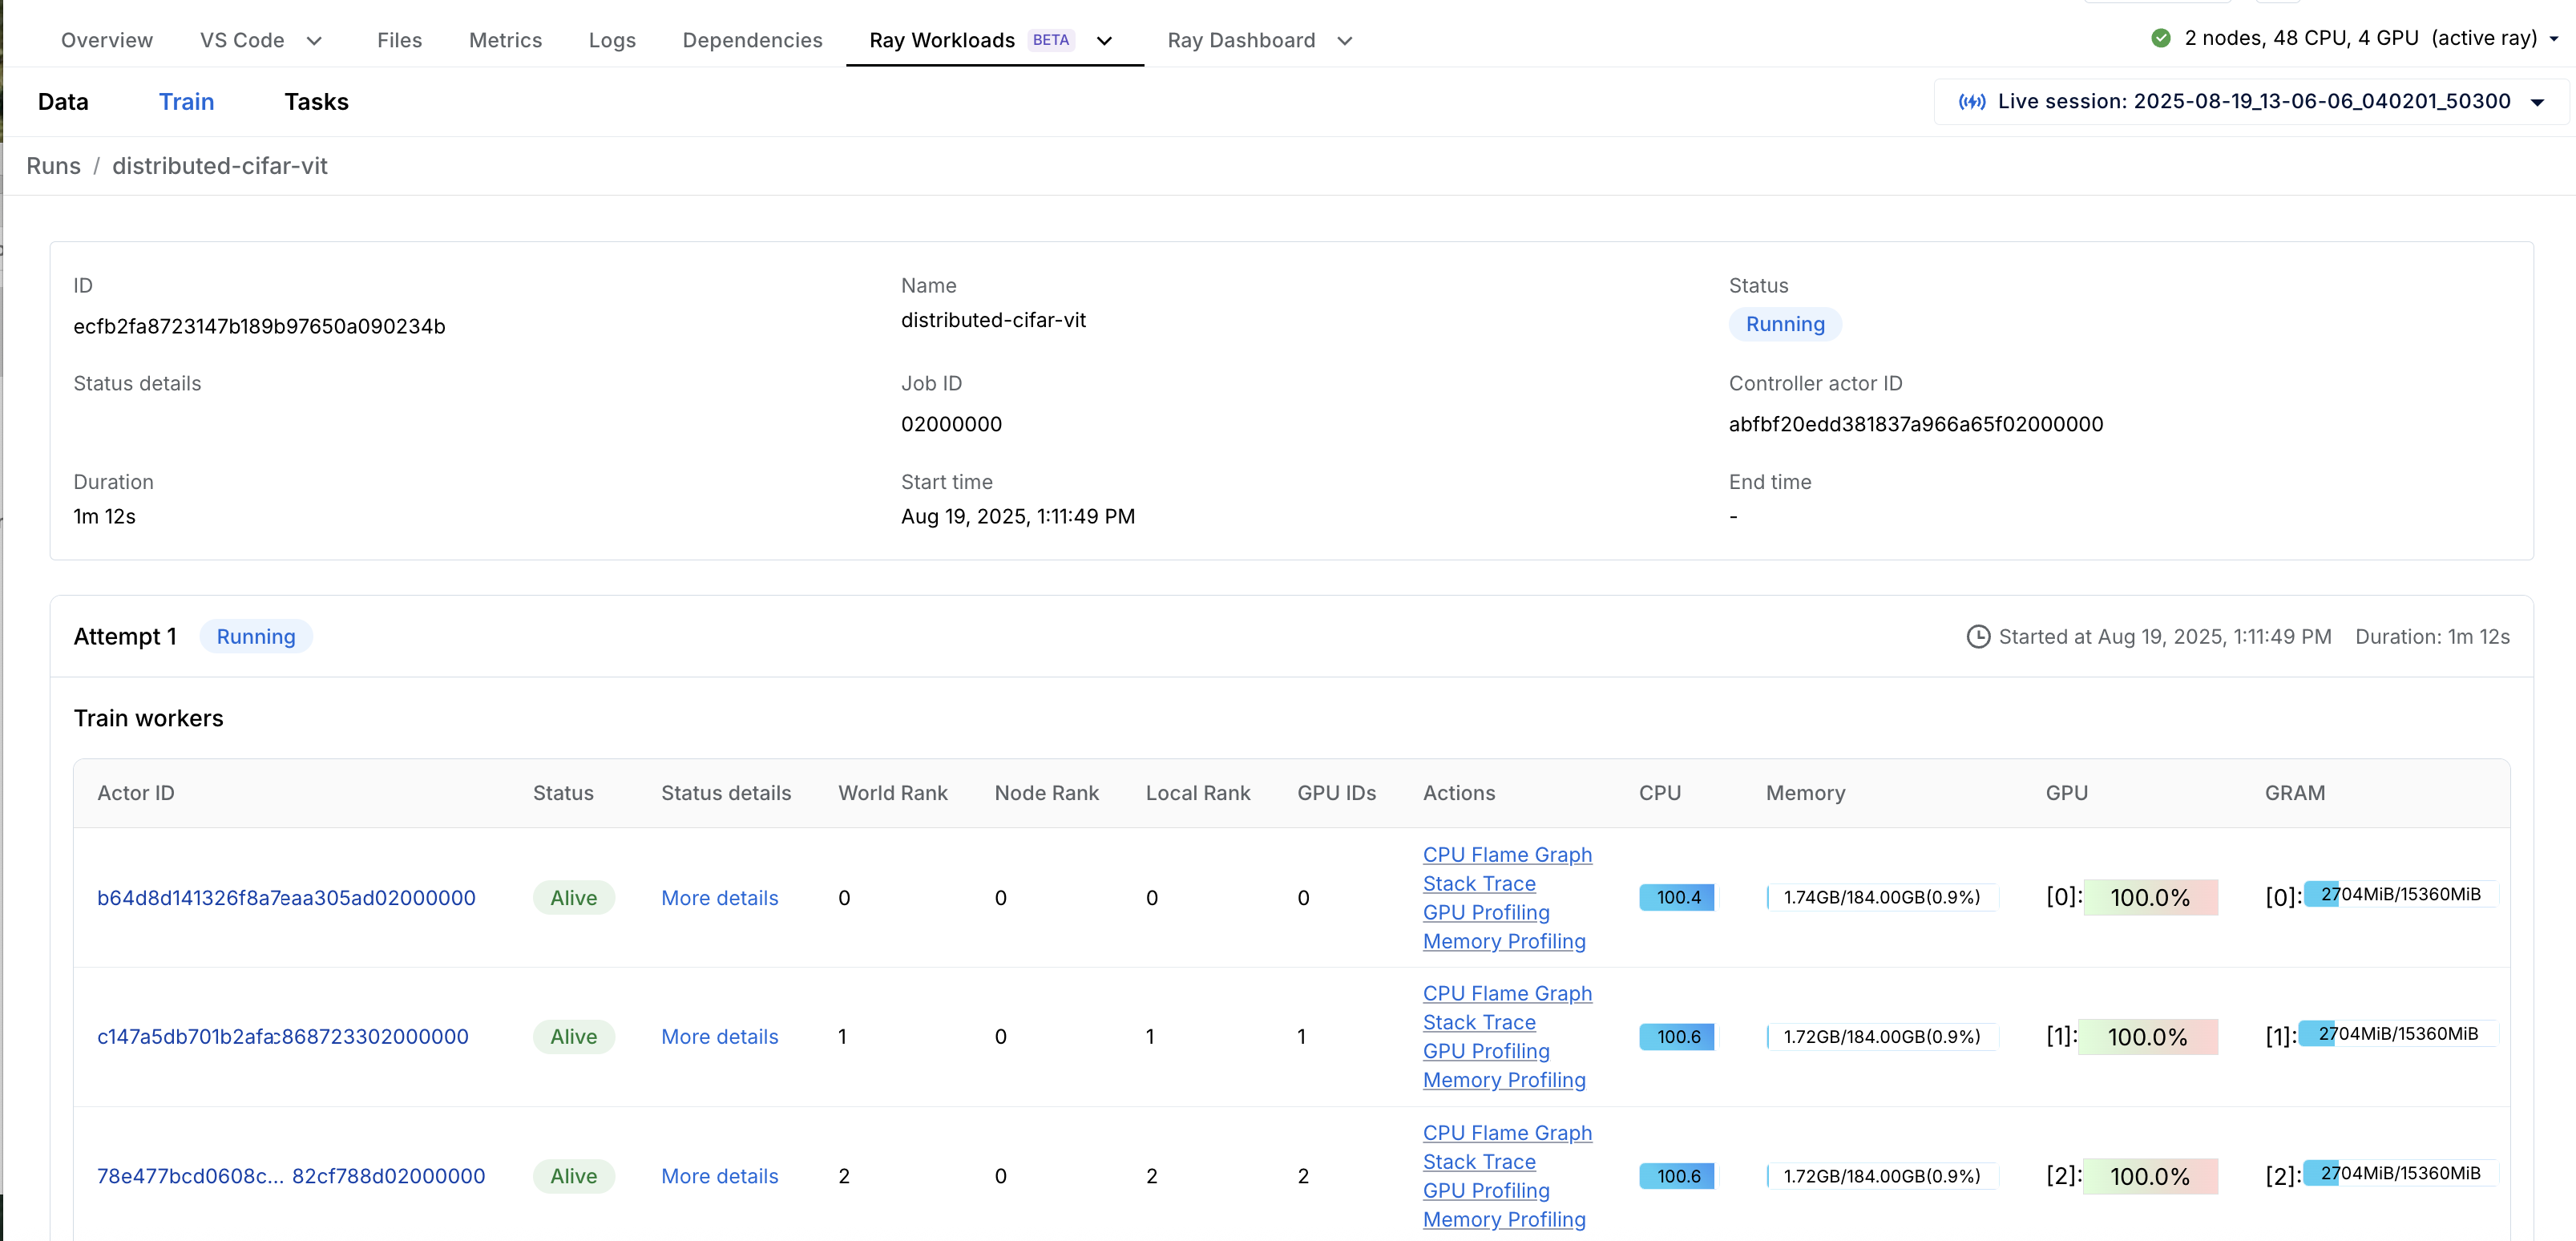
-
Training worker actor: Inspect the train worker actor for state and status.