Debug in workspaces
Debug in workspaces
Debugging is a critical part of the development process. This document provides guidance on how to debug your Ray apps using Anyscale workspaces.
Logs
The most common and versatile tool for debugging is looking at logs produced by your Ray app or by the Ray libraries. Logs can provide valuable information about the state of your app, the execution of your tasks, and any errors that occur.
While the workspace is active, you can view logs in the Ray Dashboard.
Anyscale also automatically persists logs in the cloud associated with your workspace and you can download them with the Anyscale CLI.
If you enable log ingestion, you can also view logs in the Anyscale Console and use features such as filtering by text, labels, and time range.
To read more, see Accessing logs.
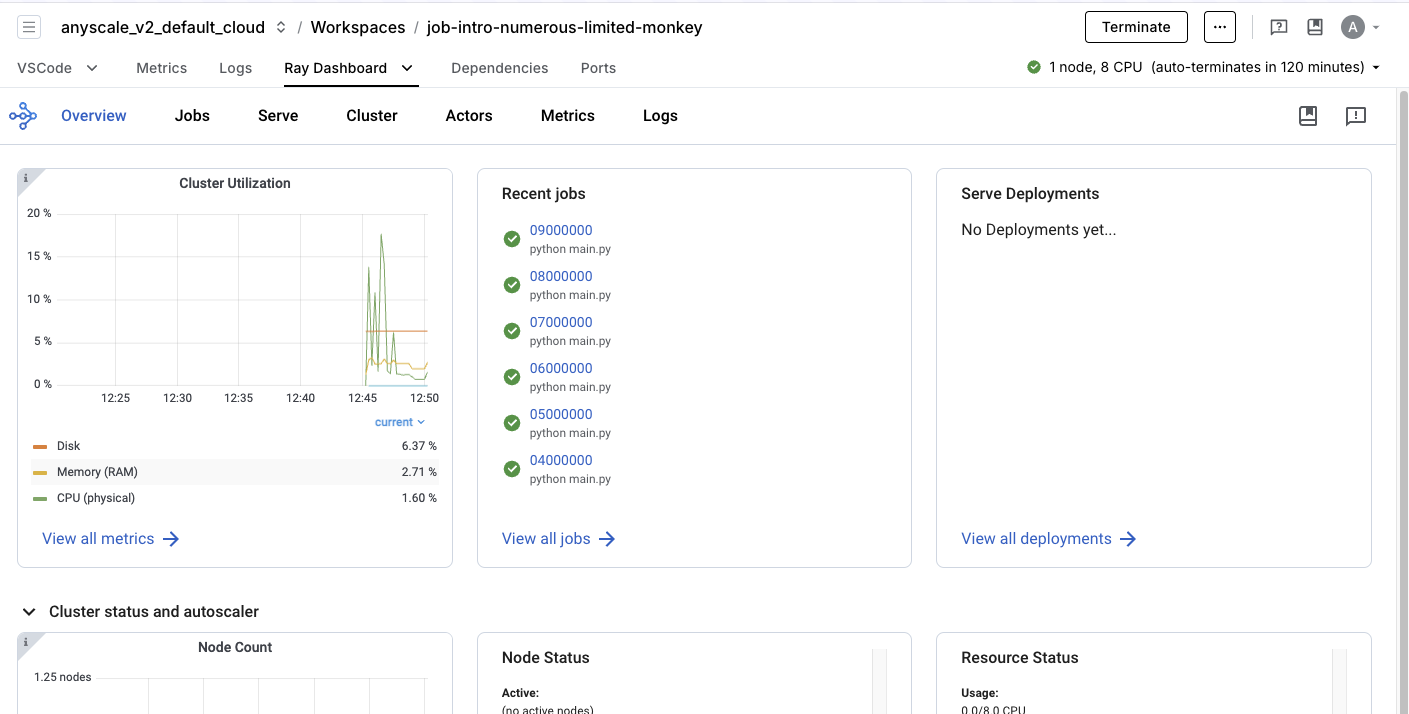
Ray dashboard
The Ray Dashboard contains several useful tools for debugging your Ray applications. View the Ray documentation to learn about how to use Ray Dashboard.
View the Ray Dashboard by clicking the "Ray Dashboard" tab in the workspace detail page.
Workloads dashboard
The workloads dashboard is a set of Anyscale-exclusive dashboards to aid with debugging Ray workloads. You can access it by clicking the Ray Workloads tab in the Workspace page.
To learn more about the workloads dashboard, see the Workloads dashboard documentation.
Metrics
Sometimes metrics can be useful for debugging as well. Metrics can provide insight into the performance of your application, the resource usage of your cluster, and the behavior of your tasks.
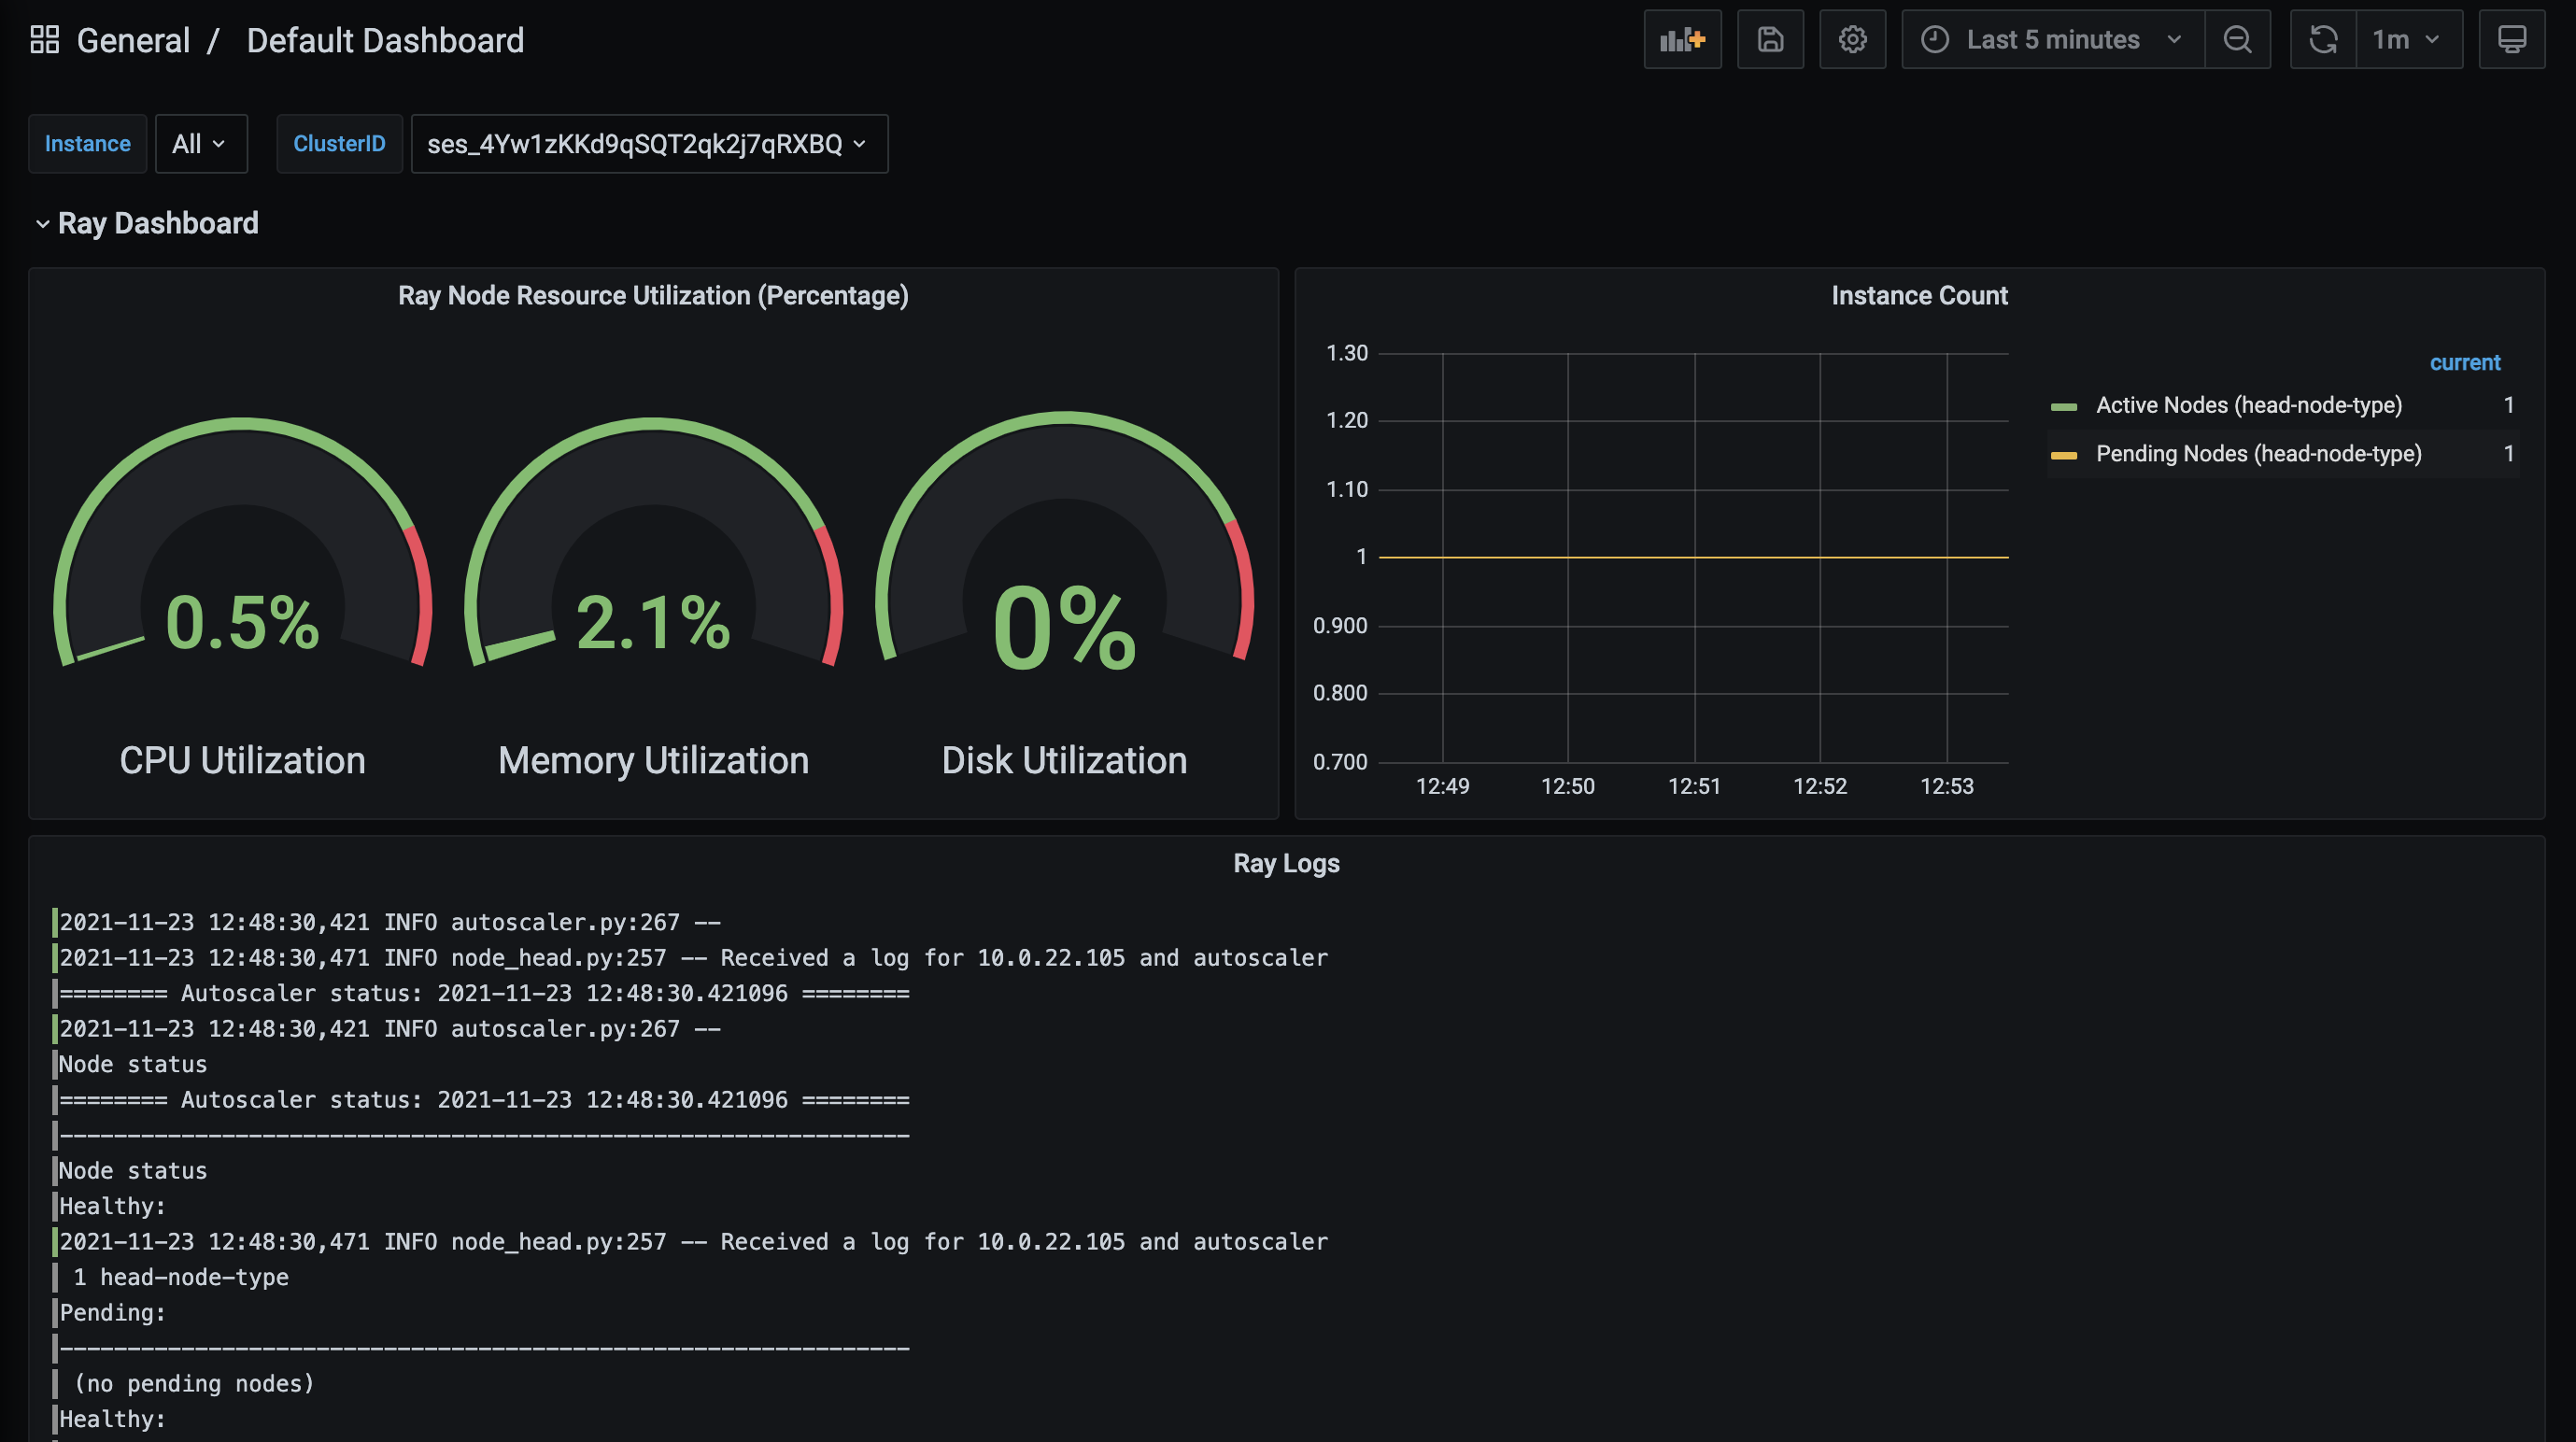
You can view metrics in the Anyscale Console in the Metrics tab of your workspace. Metrics are also available in Grafana for a more advanced UI which allows you to create custom dashboards for visualizing your metrics, including custom metrics.
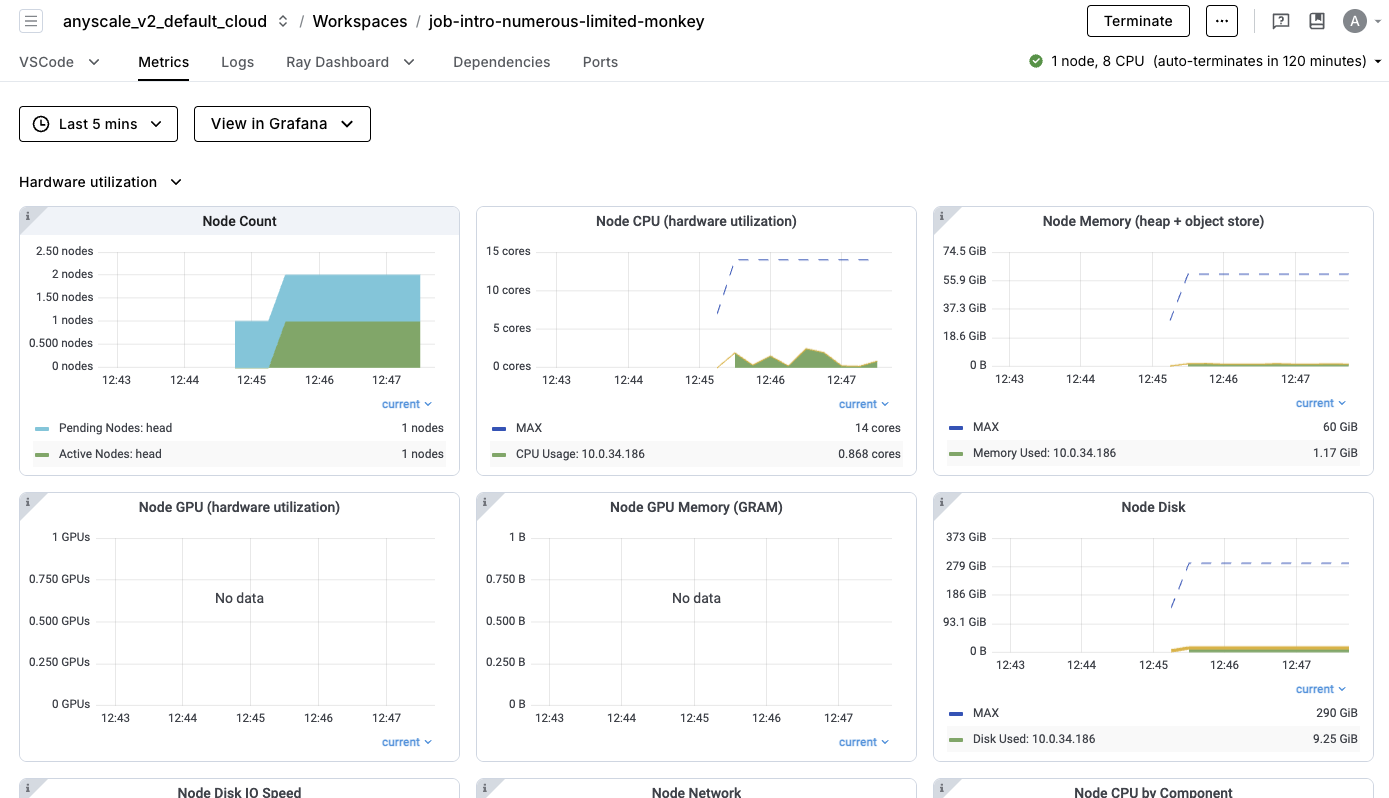
To access Grafana, click the "View in Grafana" button within the Metrics tab.
Distributed debugger
Ray Distributed Debugger is an VS Code extension that streamlines the interactive debugging process. Anyscale natively integrates the Ray Distributed Debugger and makes it work out of the box for workspaces.
This feature allows you to break into any remote task running anywhere in your Ray cluster and perform post-mortem debugging when tasks hit an exception.
The Ray Distributed Debugger is only available in VS Code and other VS Code-compatible IDEs such as Cursor. If you need support for other IDEs, contact support@Anyscale.com.
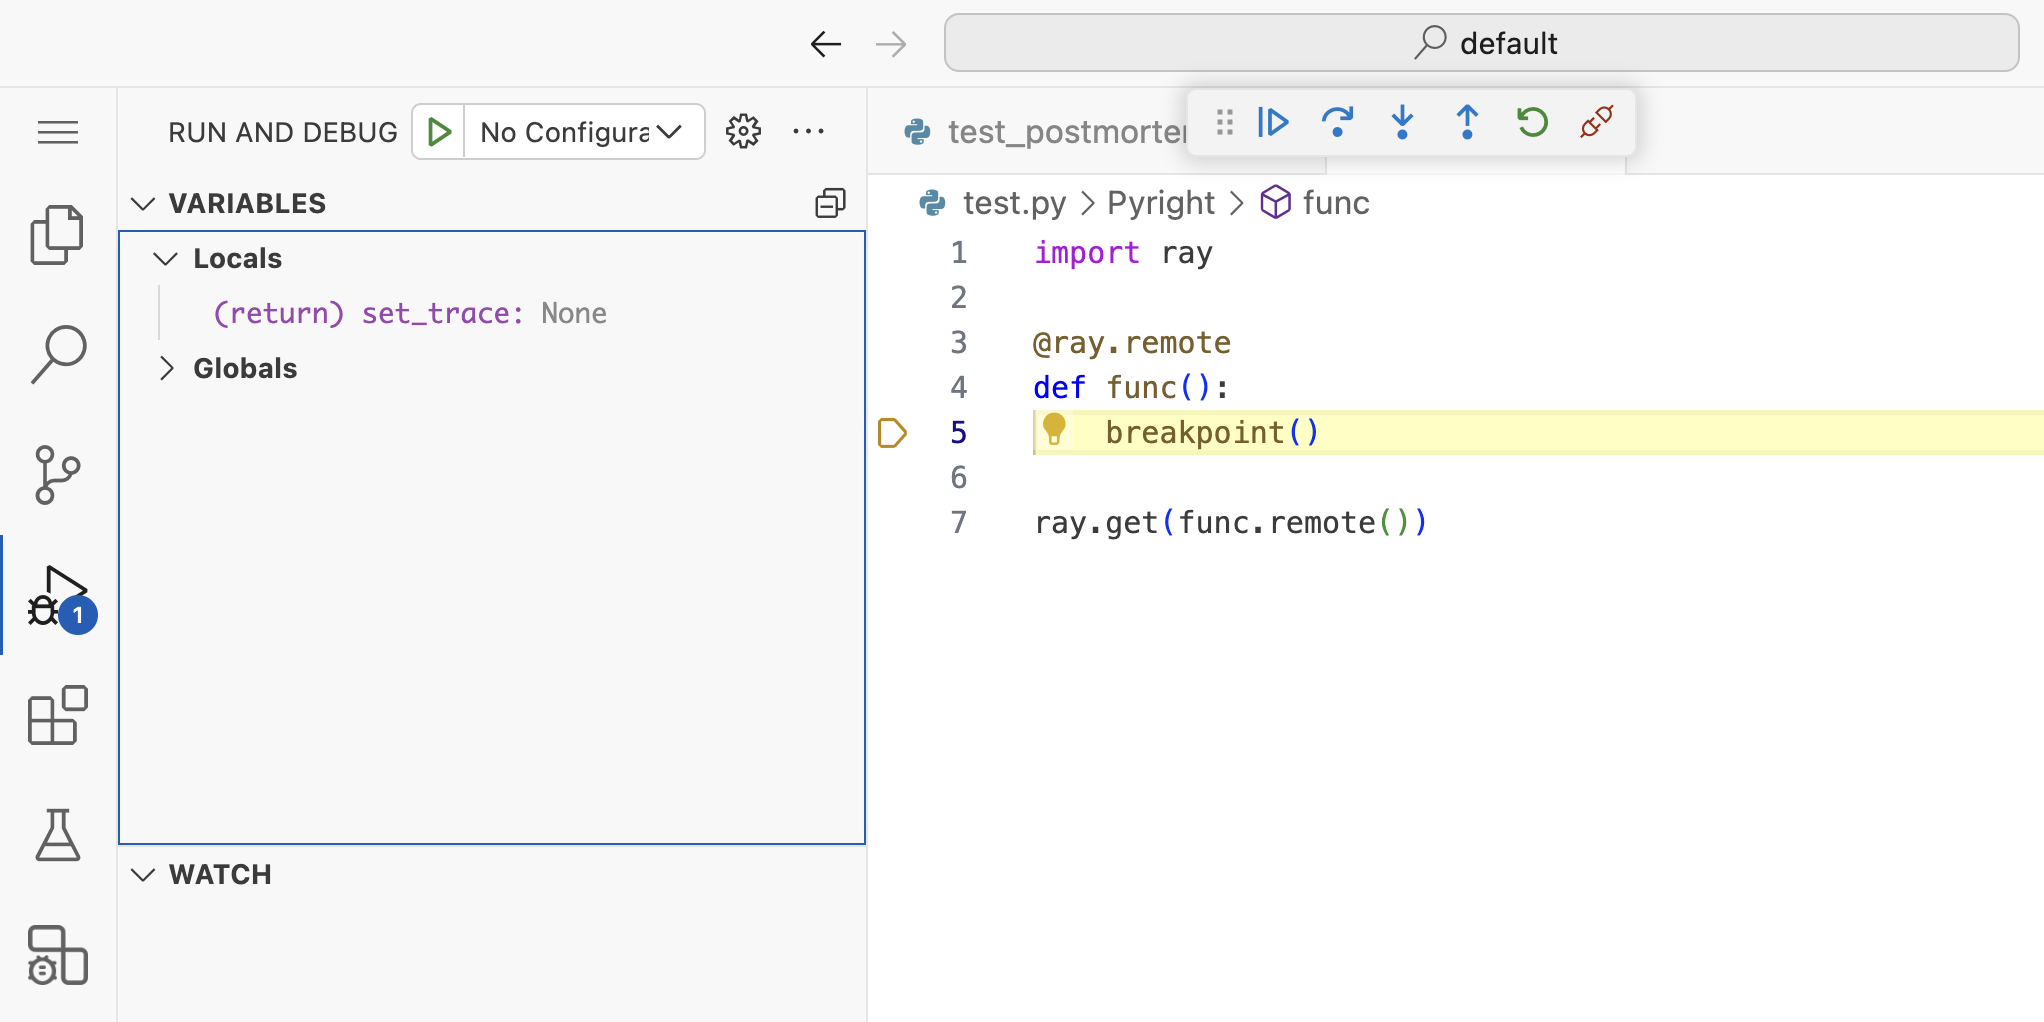
Breaking into tasks with breakpoint()
You can insert a breakpoint directly into your Ray tasks using the standard Python breakpoint() method. When your code hits the breakpoint, it pauses execution, allowing you to connect with VS Code and inspect or modify the state of the program.
To set breakpoints, complete the following:
- Insert
breakpoint()at the desired point in your Ray task. - Run your Ray application.
- When your program hits the breakpoint, the task enters a paused state. The terminal displays this information.
(func pid=10957) Ray debugger is listening on 10.0.241.176:35541
(func pid=10957) Waiting for debugger to attach (see https://docs.ray.io/en/latest/ray-observability/ray-distributed-debugger.html)...
- Open the Anyscale Debug extension in the sidebar of VS Code, which lists paused tasks. Select the paused task you want to attach to.
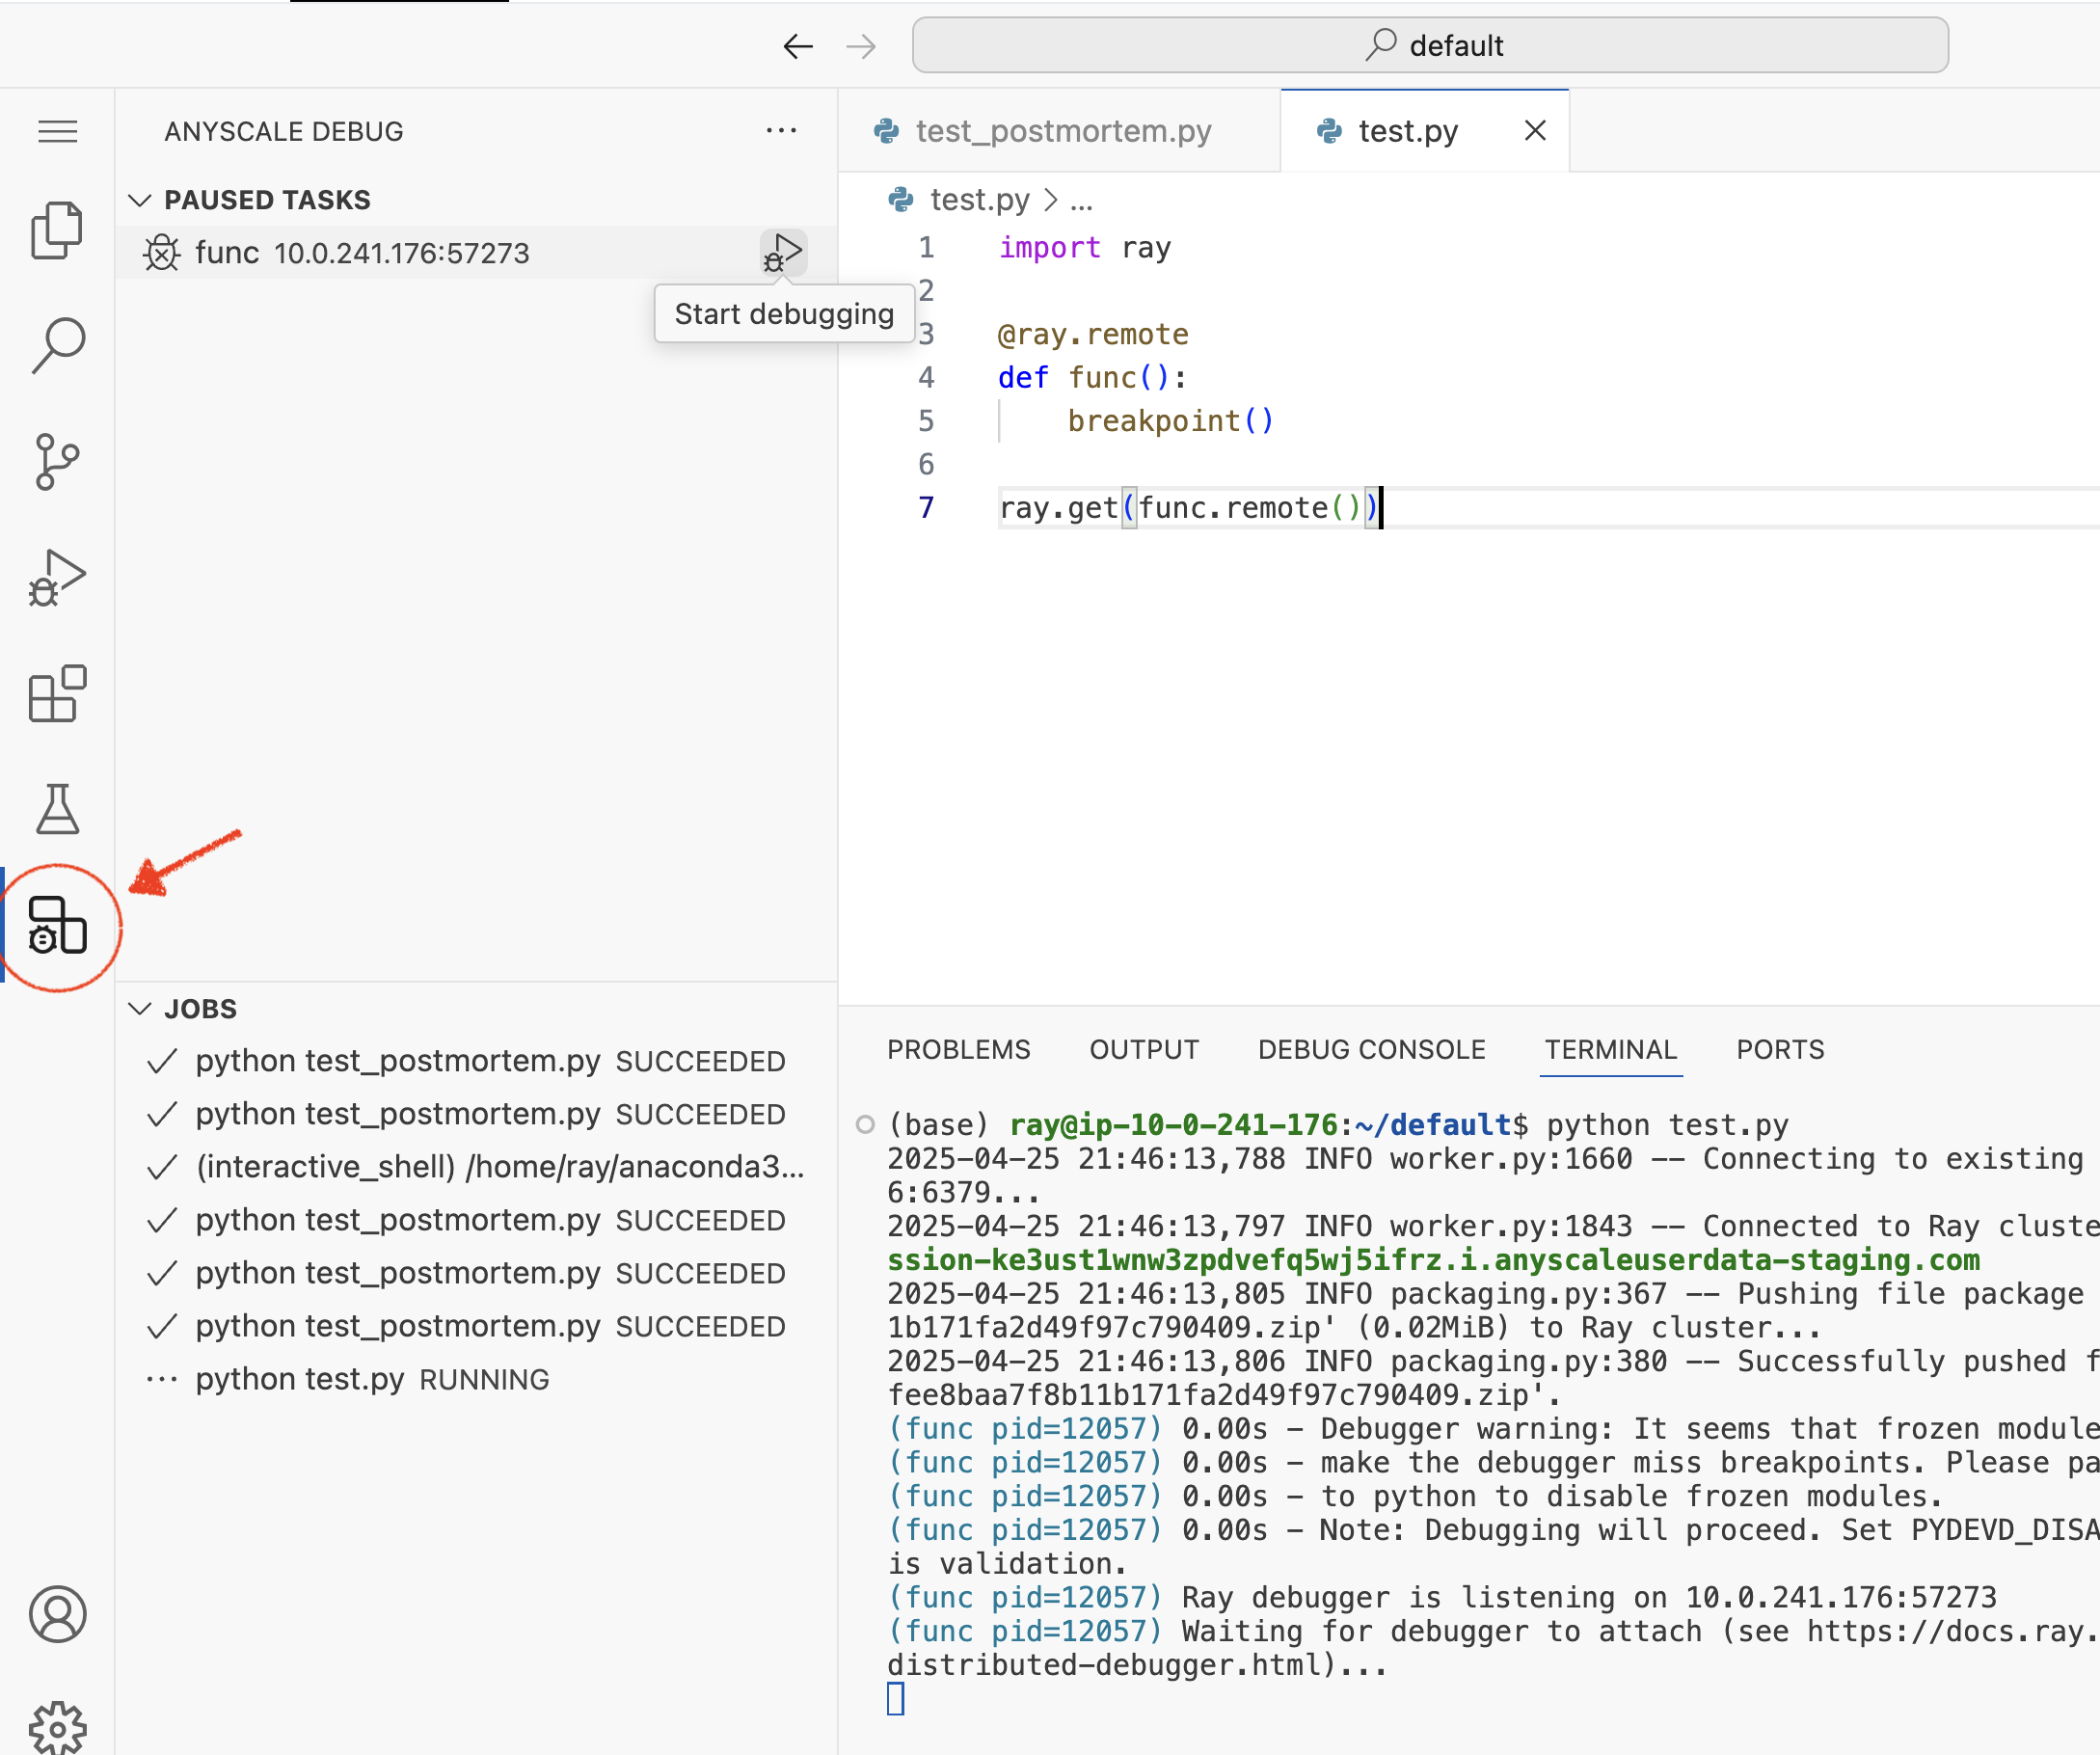
- Use the VS Code debugger like you do when developing locally.
Postmortem debugging
Postmortem debugging is crucial for diagnosing issues that cause uncaught exceptions in your tasks. When a task raises an exception, Ray freezes its state and waits for a debugger to attach, allowing you to inspect the state of the program at the time of the error.
To enable postmortem debugging, set the RAY_DEBUG_POST_MORTEM environment variable in runtime_env inside ray.init.
ray.init(runtime_env={
    "env_vars": {"RAY_DEBUG_POST_MORTEM": "1"},
})
To use postmortem debugging, complete the following:
- Ensure your environment is correctly set up by enabling the
RAY_DEBUG_POST_MORTEMvariable and having a supported Ray version. - Run your Ray application.
- When a task throws an unhandled exception, it enters a paused state. The terminal displays this information.
(func pid=9894) Ray debugger is listening on 10.0.241.176:41065
(func pid=9894) Waiting for debugger to attach (see https://docs.ray.io/en/latest/ray-observability/ray-distributed-debugger.html)...
- Open the Anyscale Debug extension in the sidebar of VS Code, which lists paused tasks. Select the paused task you want to attach to.
- Use the VS Code debugger like you do when developing locally.
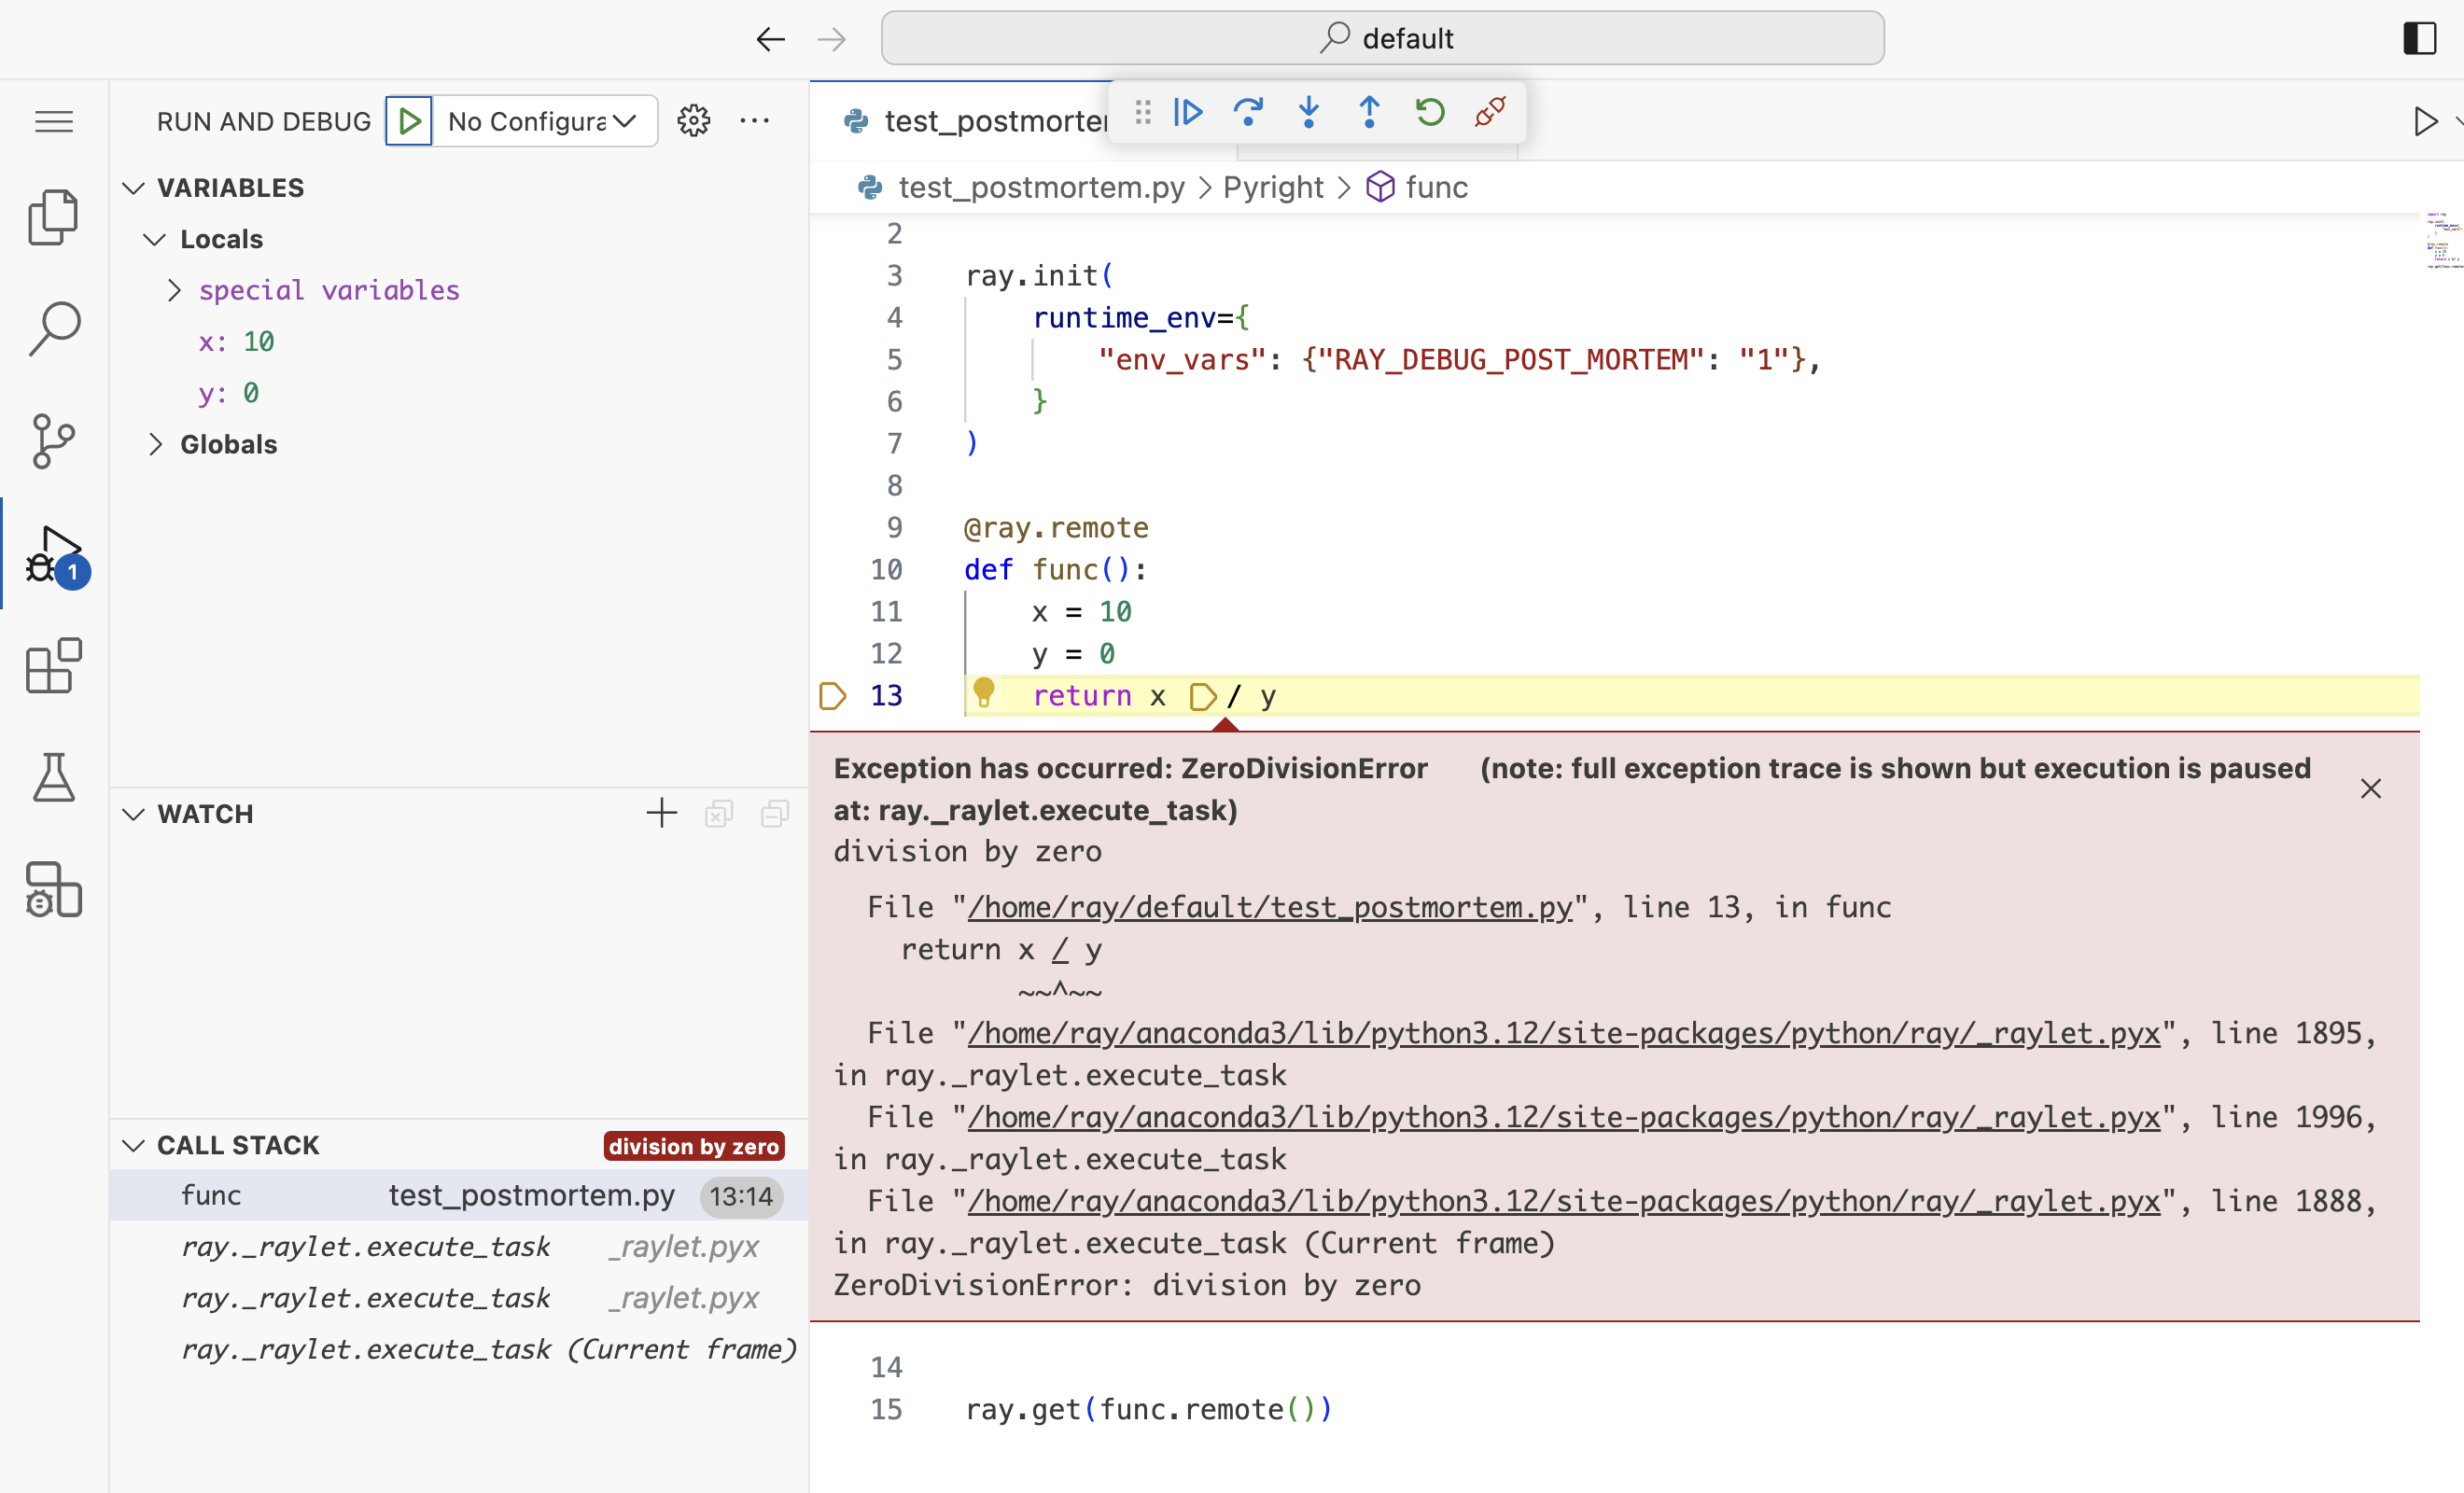
Ensure that you enable the "unhandled exception" option in VS Code's debugger settings. This setting allows VS Code to break execution at the point where the exception occurred, enabling you to perform post-mortem analysis.
Use SSH to access worker nodes
To SSH into a worker node, run the following command from the head node of a cluster.
ssh -p 2222 IP_ADDRESS
To find the IP_ADDRESS of a worker node, select the Cluster
tab in the Ray Dashboard.

More info
- To learn more details about the Ray Dashboard, see the Ray Dashboard documentation
- To learn more about Grafana and how to use it, see the official Grafana documentation