Troubleshooting
Workspaces provide a couple of tools for troubleshooting, accessible from the Workspace UI:
- Events
- Logs
- Ray Dashboard
- Grafana
Logs
Workspaces give you easy access to your application logs, Ray logs, and other logs. You can use them to troubleshoot issues from the node level to the application code level.
Command history
Command history shows the Driver log which is the output from the Driver of your Ray application, for example, main.py.
- When you run commands in the Web Terminal, the command and its output will be persisted in the Command History tab on the Workspace UI.
- When you run commands in JupyterLab terminal or VS Code terminal, the output will not be persisted when you close the IDE.
- Worker logs (logs of Ray tasks and actors from the Ray’s worker processes) by default are redirected to driver log.
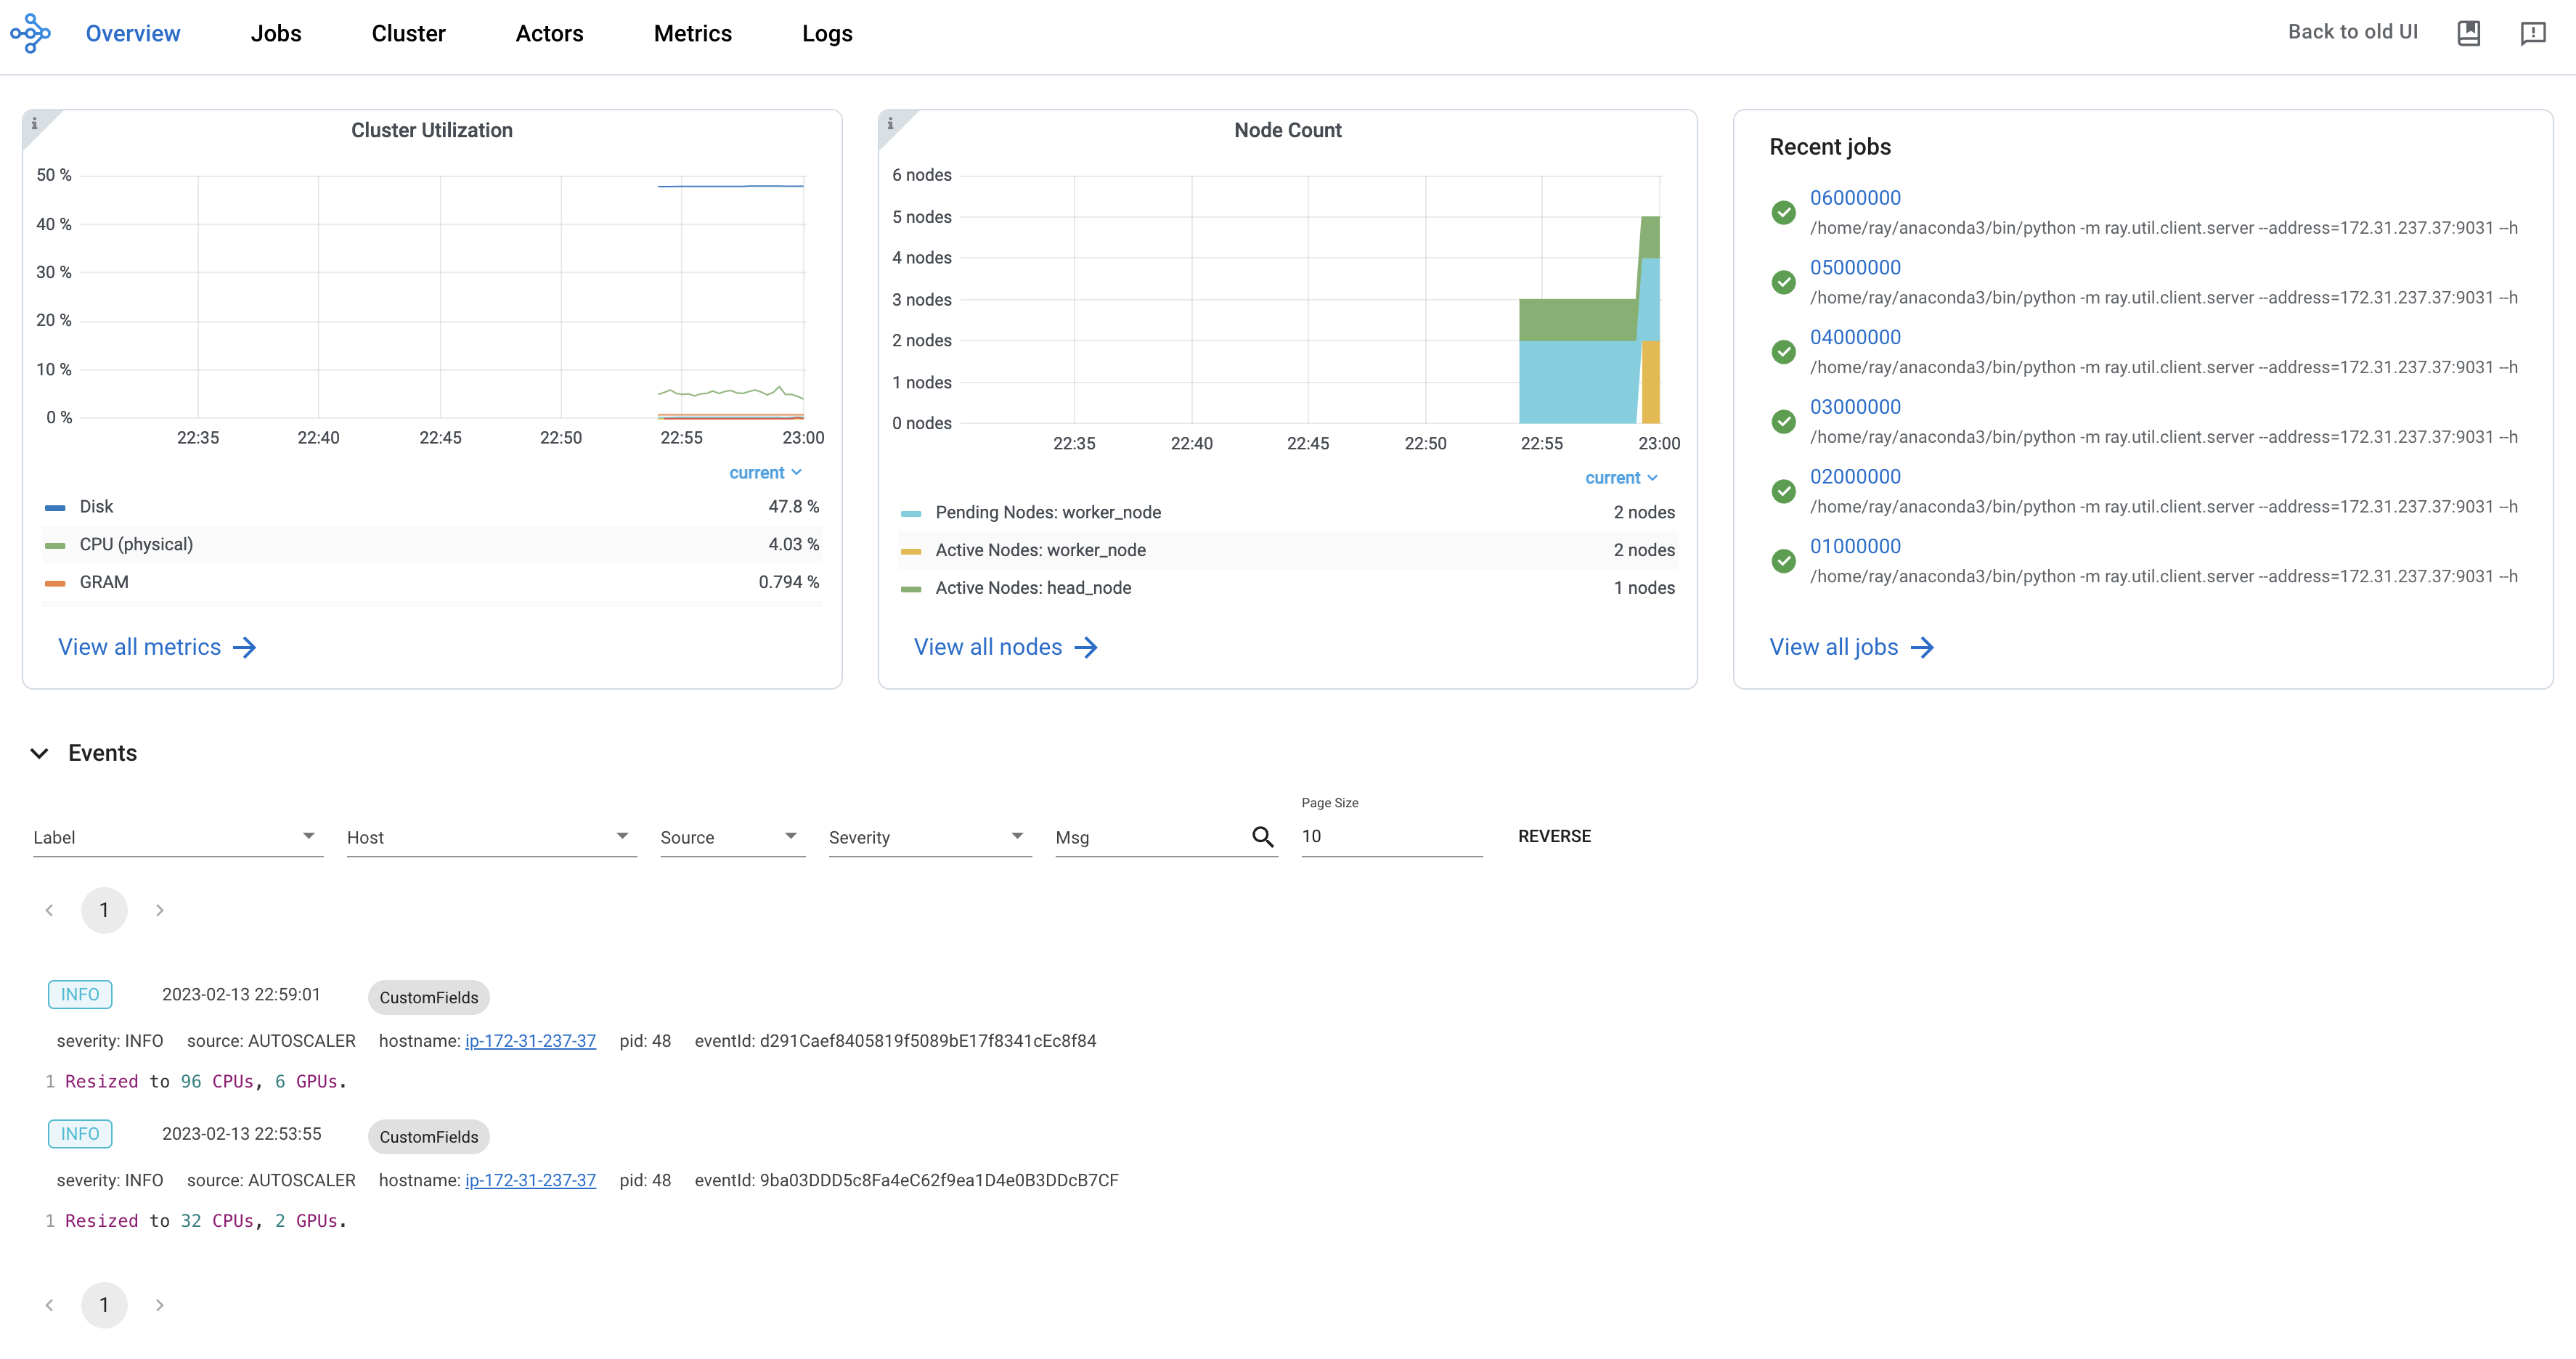
Event log
The Event log captures autoscaling activity, node status, cluster environment preparation, and cluster status.
Ray logs
Ray logs refer to the logs of Ray components like GCS, dashboard, etc. Learn more in the Ray documentation.
- When the Workspace is active, you can use Ray Dashboard to view Ray logs.
- When the Workspace is terminated, you can download all the Ray logs following the instruction on the Workspace UI.
TensorBoard
TensorBoard is useful for viewing logs and outputs from Ray. You may consider starting a TensorBoard server in the workspace to view TensorBoard logs. Steps to start a TensorBoard server:
- Open the Web Terminal in the workspace.
- Run
$ pip install tensorboardto install TensorBoard in the workspace. - Run
$ tensorboard --logdir <path_to_log_dir>to start a TensorBoard server. - Visit the TensorBoard via the port list in the workspace page. The TensorBoard will be available at port
6006by default.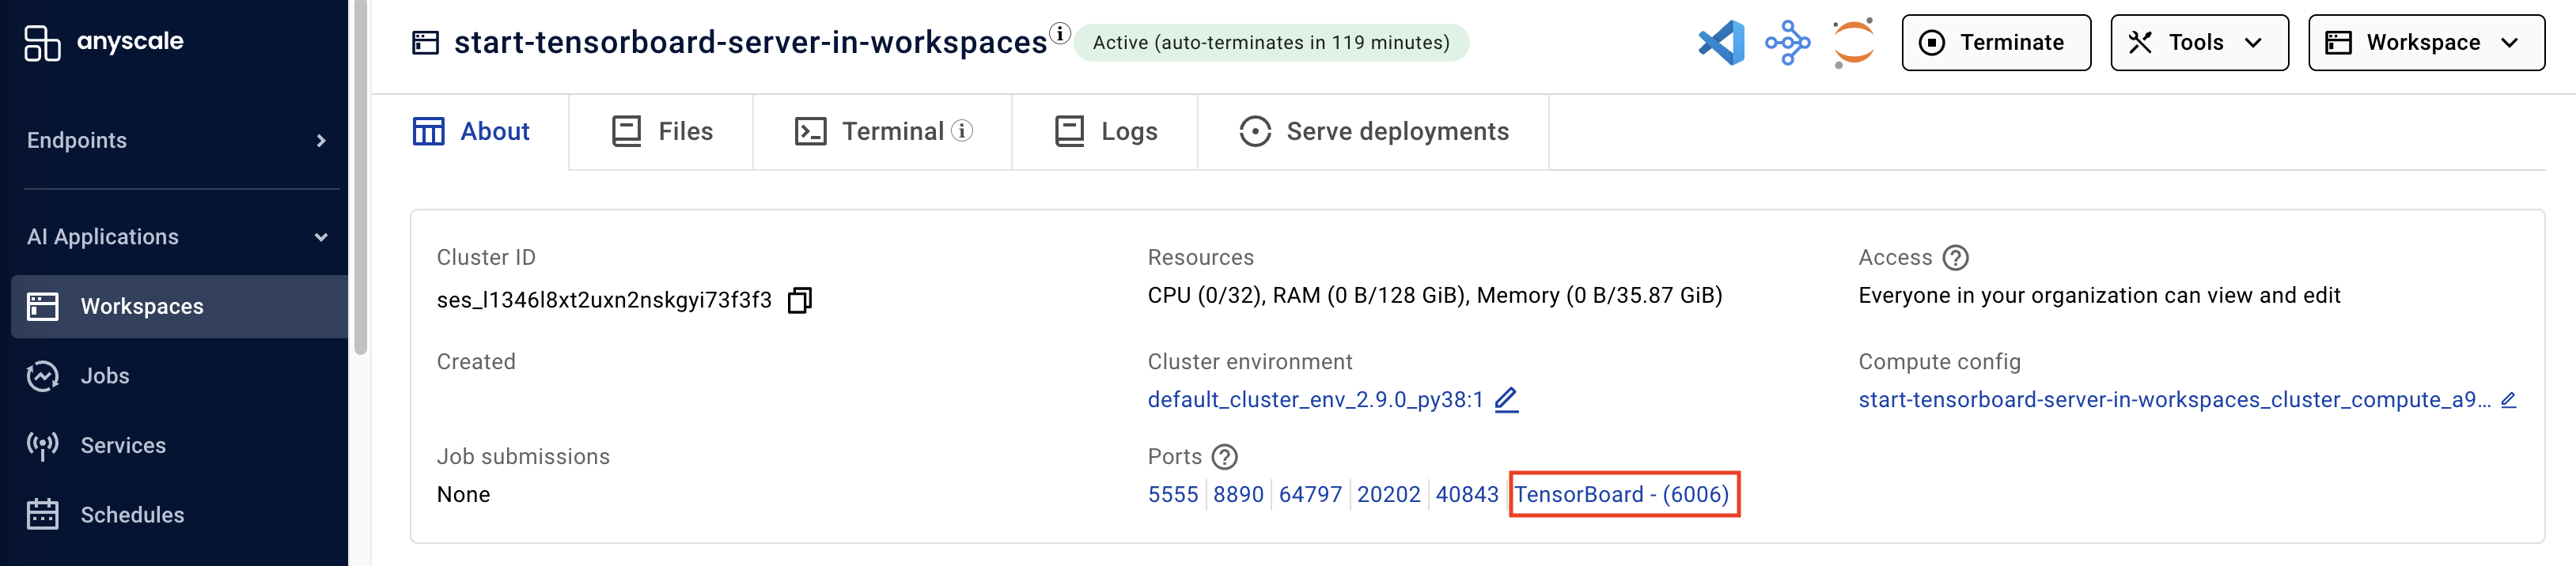
Current limitation: In Workspaces, TensorBoard extension is not supported in the JupyterLab and VSCode.
Serve controller log
Serve controller log provides information about HTTP proxy, replica, and deployment status.
Ray Dashboard
View the Ray documentation to learn about how to use Ray Dashboard.
Grafana
Click on the Grafana button from "Tools" to display the performance metrics of the underlying Ray cluster.
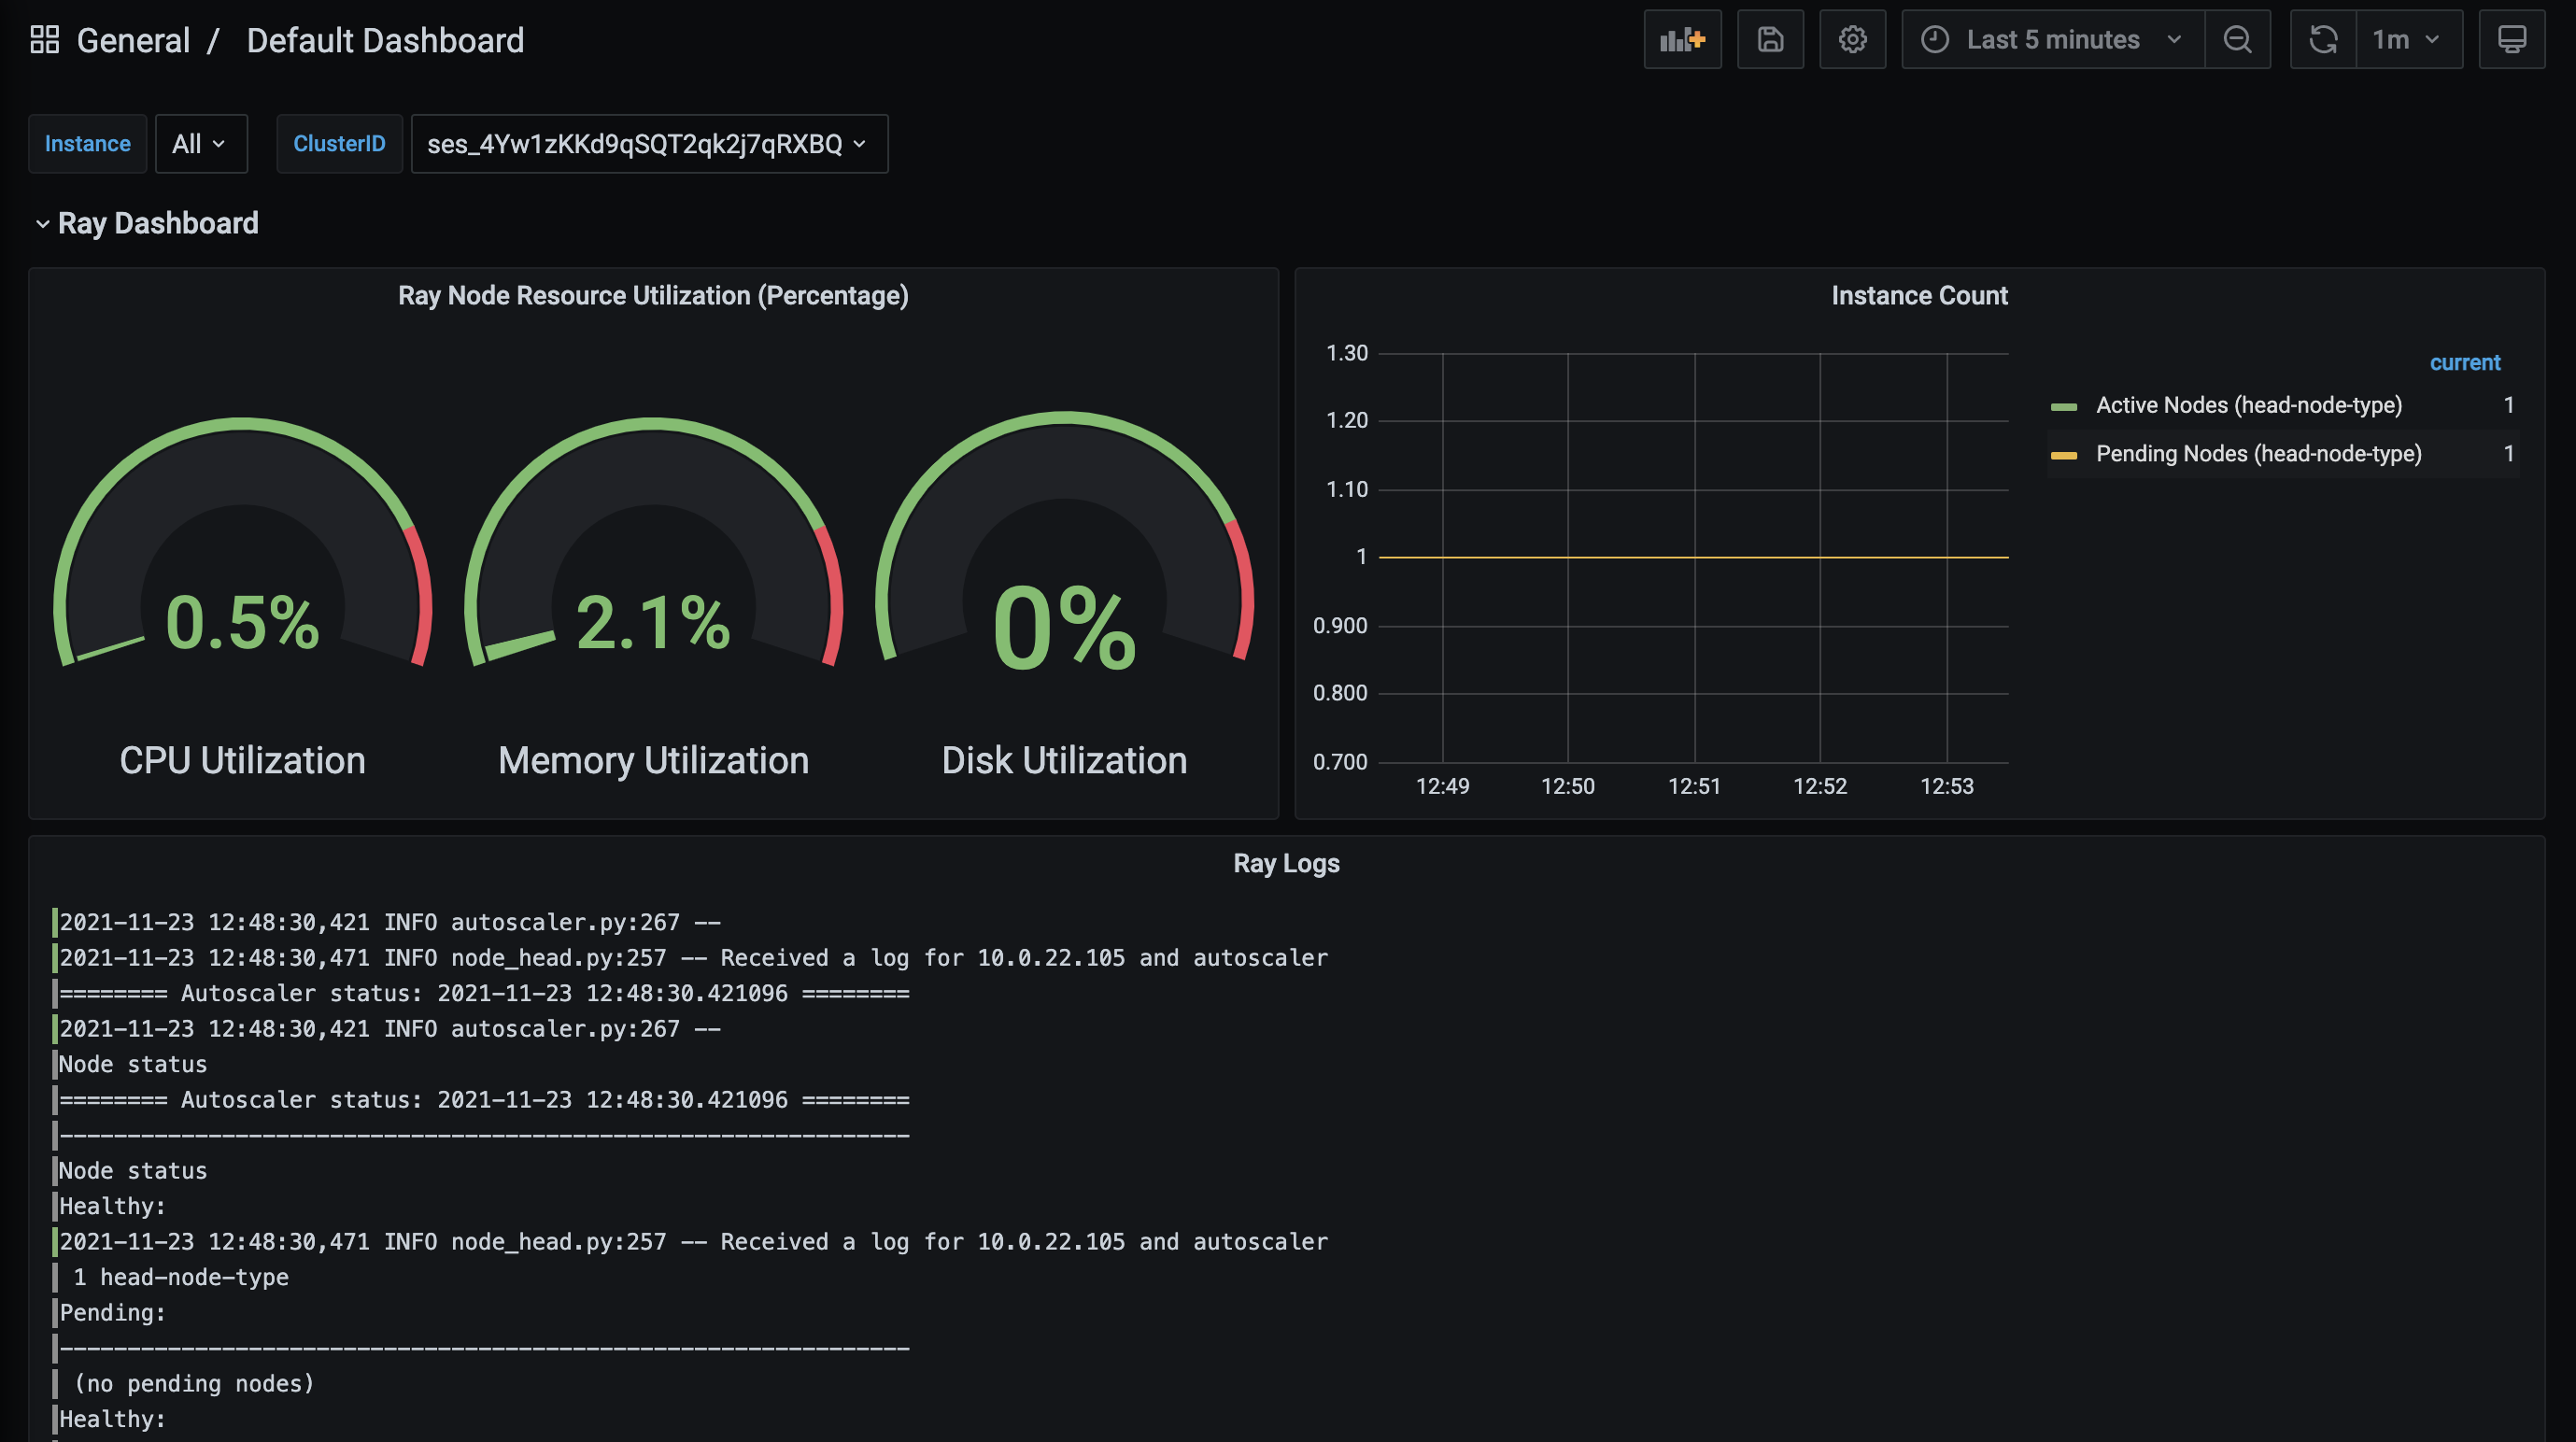
Grafana dashboard data is retained for 90 days from cluster termination.