Monitor a job
Anyscale jobs provides several tools to monitor your jobs:
- Job detail page
- Metrics
- Logs
- Notifications
- Alerts
- Ray Dashboard
- Workloads dashboard
- Exporting logs and metrics
This document describes each use case and provides suggestions for when to use each tool.
Job detail page
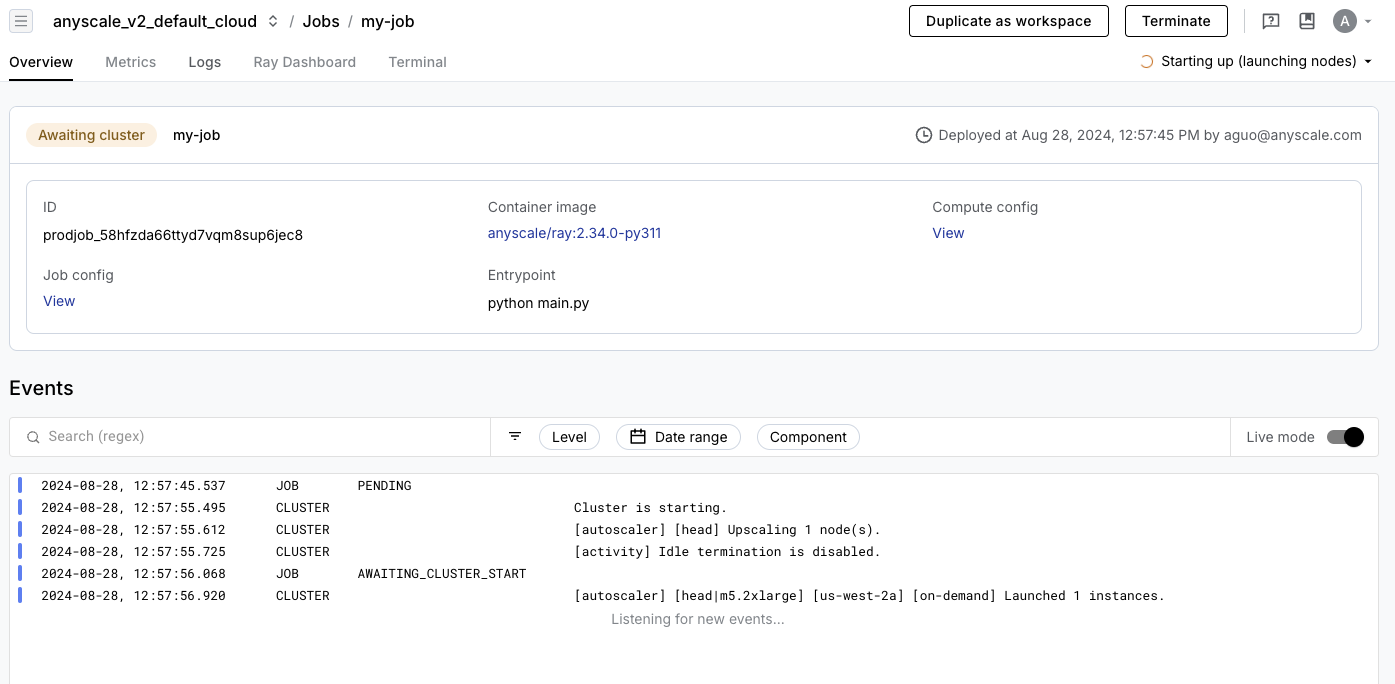
The job detail page contains the status of the job, information about your job's configuration, details about each job attempt, events of the job, and links to various other tools.

The job events log is at the bottom of the page. This log lists events of your job and includes events about your job lifecycle and errors.
Metrics
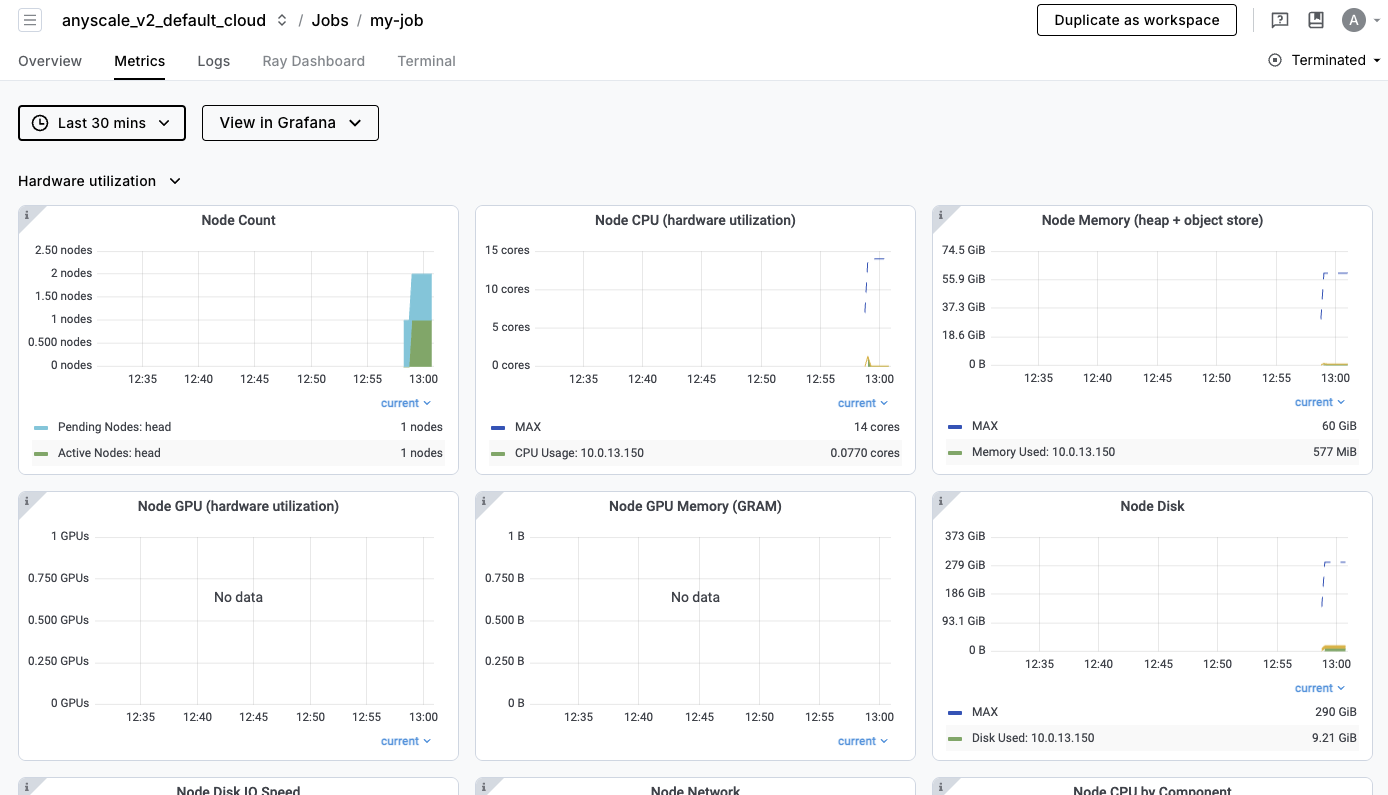
Access metrics related to your job in the Metrics tab of the job detail page.

Job metrics tracks hardware metrics and system-level metrics such as CPU or network utilization, memory, or disk usage, node count, number of Ray tasks, and number of active Ray actors.
Metrics are also available in Grafana for a more advanced UI, which allows you to create custom dashboards for visualizing the metrics, including custom metrics.
Access Grafana by clicking the View in Grafana button in the Metrics tab.
Logs
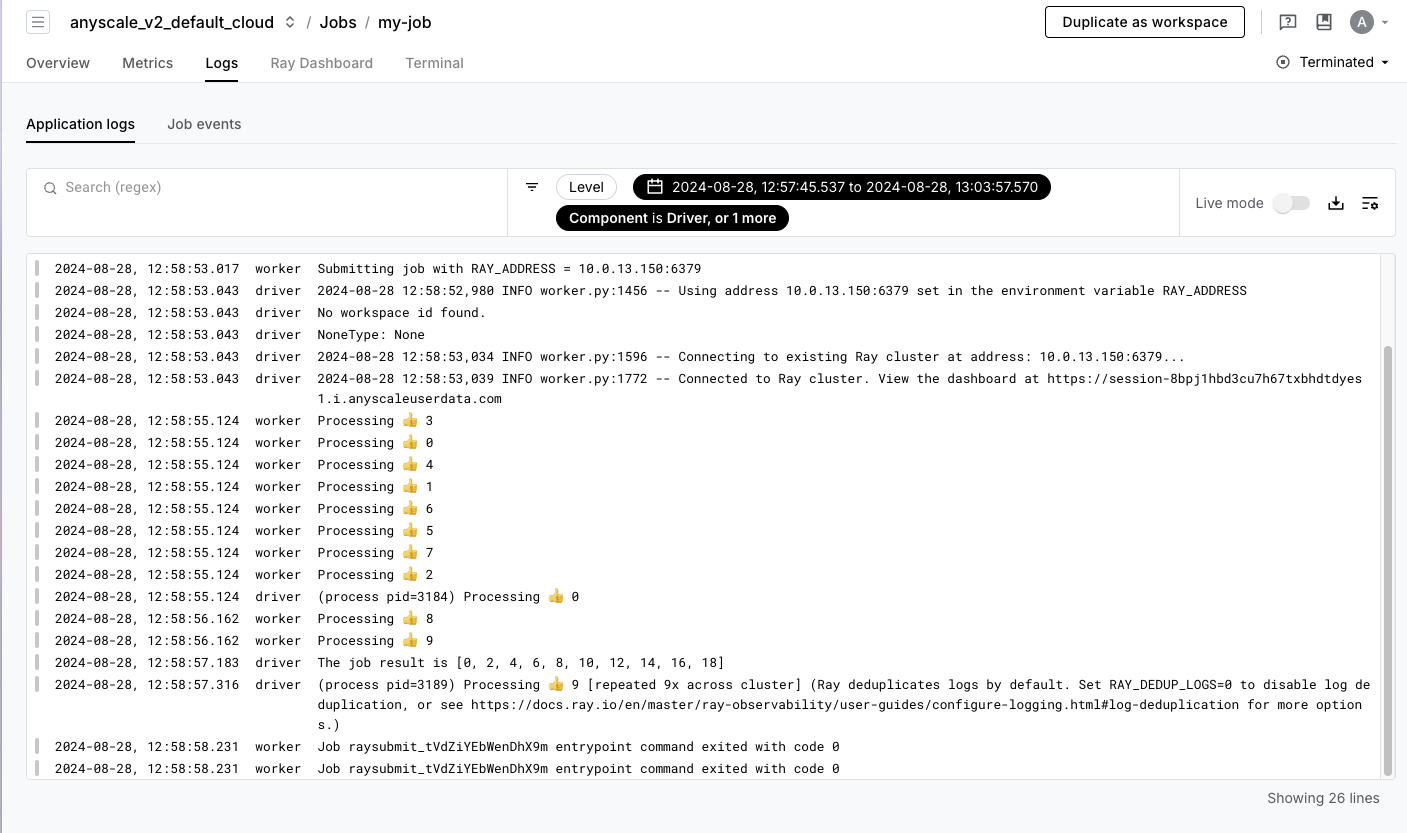
Logs are another source of information when debugging issues with your job. You can view the logs of your job by clicking the "Logs" tab in the job detail page.
By default, you can will see the driver logs of your job. If the job is still running, you can also view the Ray logs of the job through the Ray Dashboard.
Log viewer
If you have enabled log ingestion, you have access to the Anyscale log viewer

With the Anyscale log viewer, you have access to all Ray logs of your jobs and can search and filter by time, text, or labels such as task name, node ID, and more.
By default, the logs are filtered to the time range of the job with no filters. You can change the time range by clicking the time range dropdown and select an end time and time window to look back. Anyscale stores up to 30 days of logs for your job. You're able to debug issues even after the job terminates.
To filter the logs, use the search bar to search for specific keywords.
Enter a request ID in the search bar to filter logs for a specific request. You can also
use regex to filter logs if your logs contain a specific pattern.
Notifications
Anyscale jobs have a built-in alert for when a job succeeds, fails, or retries. The creator of the job receives an email notification when the job completes. As an admin, you can also create Custom notifications such as additional emails or slack channels.
Alerts
To set up metric-based alerts based on your own criteria, see Custom dashboards and alerting guide. These alerts are useful for tracking the health of your jobs or job queues.
Ray Dashboard
The Ray Dashboard is scoped to a single Ray cluster. Each job attempt launches a new Ray cluster unless Job queues are used. To access this dashboard, click the "Ray Dashboard" tab in the job detail page.
To learn more about how to use the Ray Dashboard, see the Ray documentation.
Workloads Dashboard
The workloads dashboard is a set of Anyscale-exclusive dashboards to aid with debugging Ray workloads. It can be accessed by clicking the Ray Workloads tab in the Job details page.
To learn more about the workloads dashboard, see the Workloads dashboard documentation.
Exporting logs and metrics
If you want to push logs to Vector, a tool to ship logs to Amazon CloudWatch, Google Cloud Monitoring, Datadog, or other observability tools, see Exporting logs and metrics with Vector.
More info
- To learn more details about the Ray Dashboard, see the Ray Dashboard documentation
- To learn more about Grafana and how to use it, see the official Grafana documentation
- To learn more about the metrics that Ray emits, see the System Metrics documentation