Optimize throughput for Ray Data LLM batch inference
Optimize throughput for Ray Data LLM batch inference
This guide provides optimization techniques for Ray Data LLM batch inference. It explores fundamental performance bottlenecks in distributed batch processing and presents actionable strategies for task distribution, worker parallelism, and memory management to build fast and cost-effective batch inference pipelines.
Understand critical bottlenecks in batch inference
Optimizing batch inference throughput requires understanding the key bottlenecks that limit processing speed and efficiency. Unlike online serving where latency is critical, batch inference focuses on maximizing total throughput across the entire dataset.
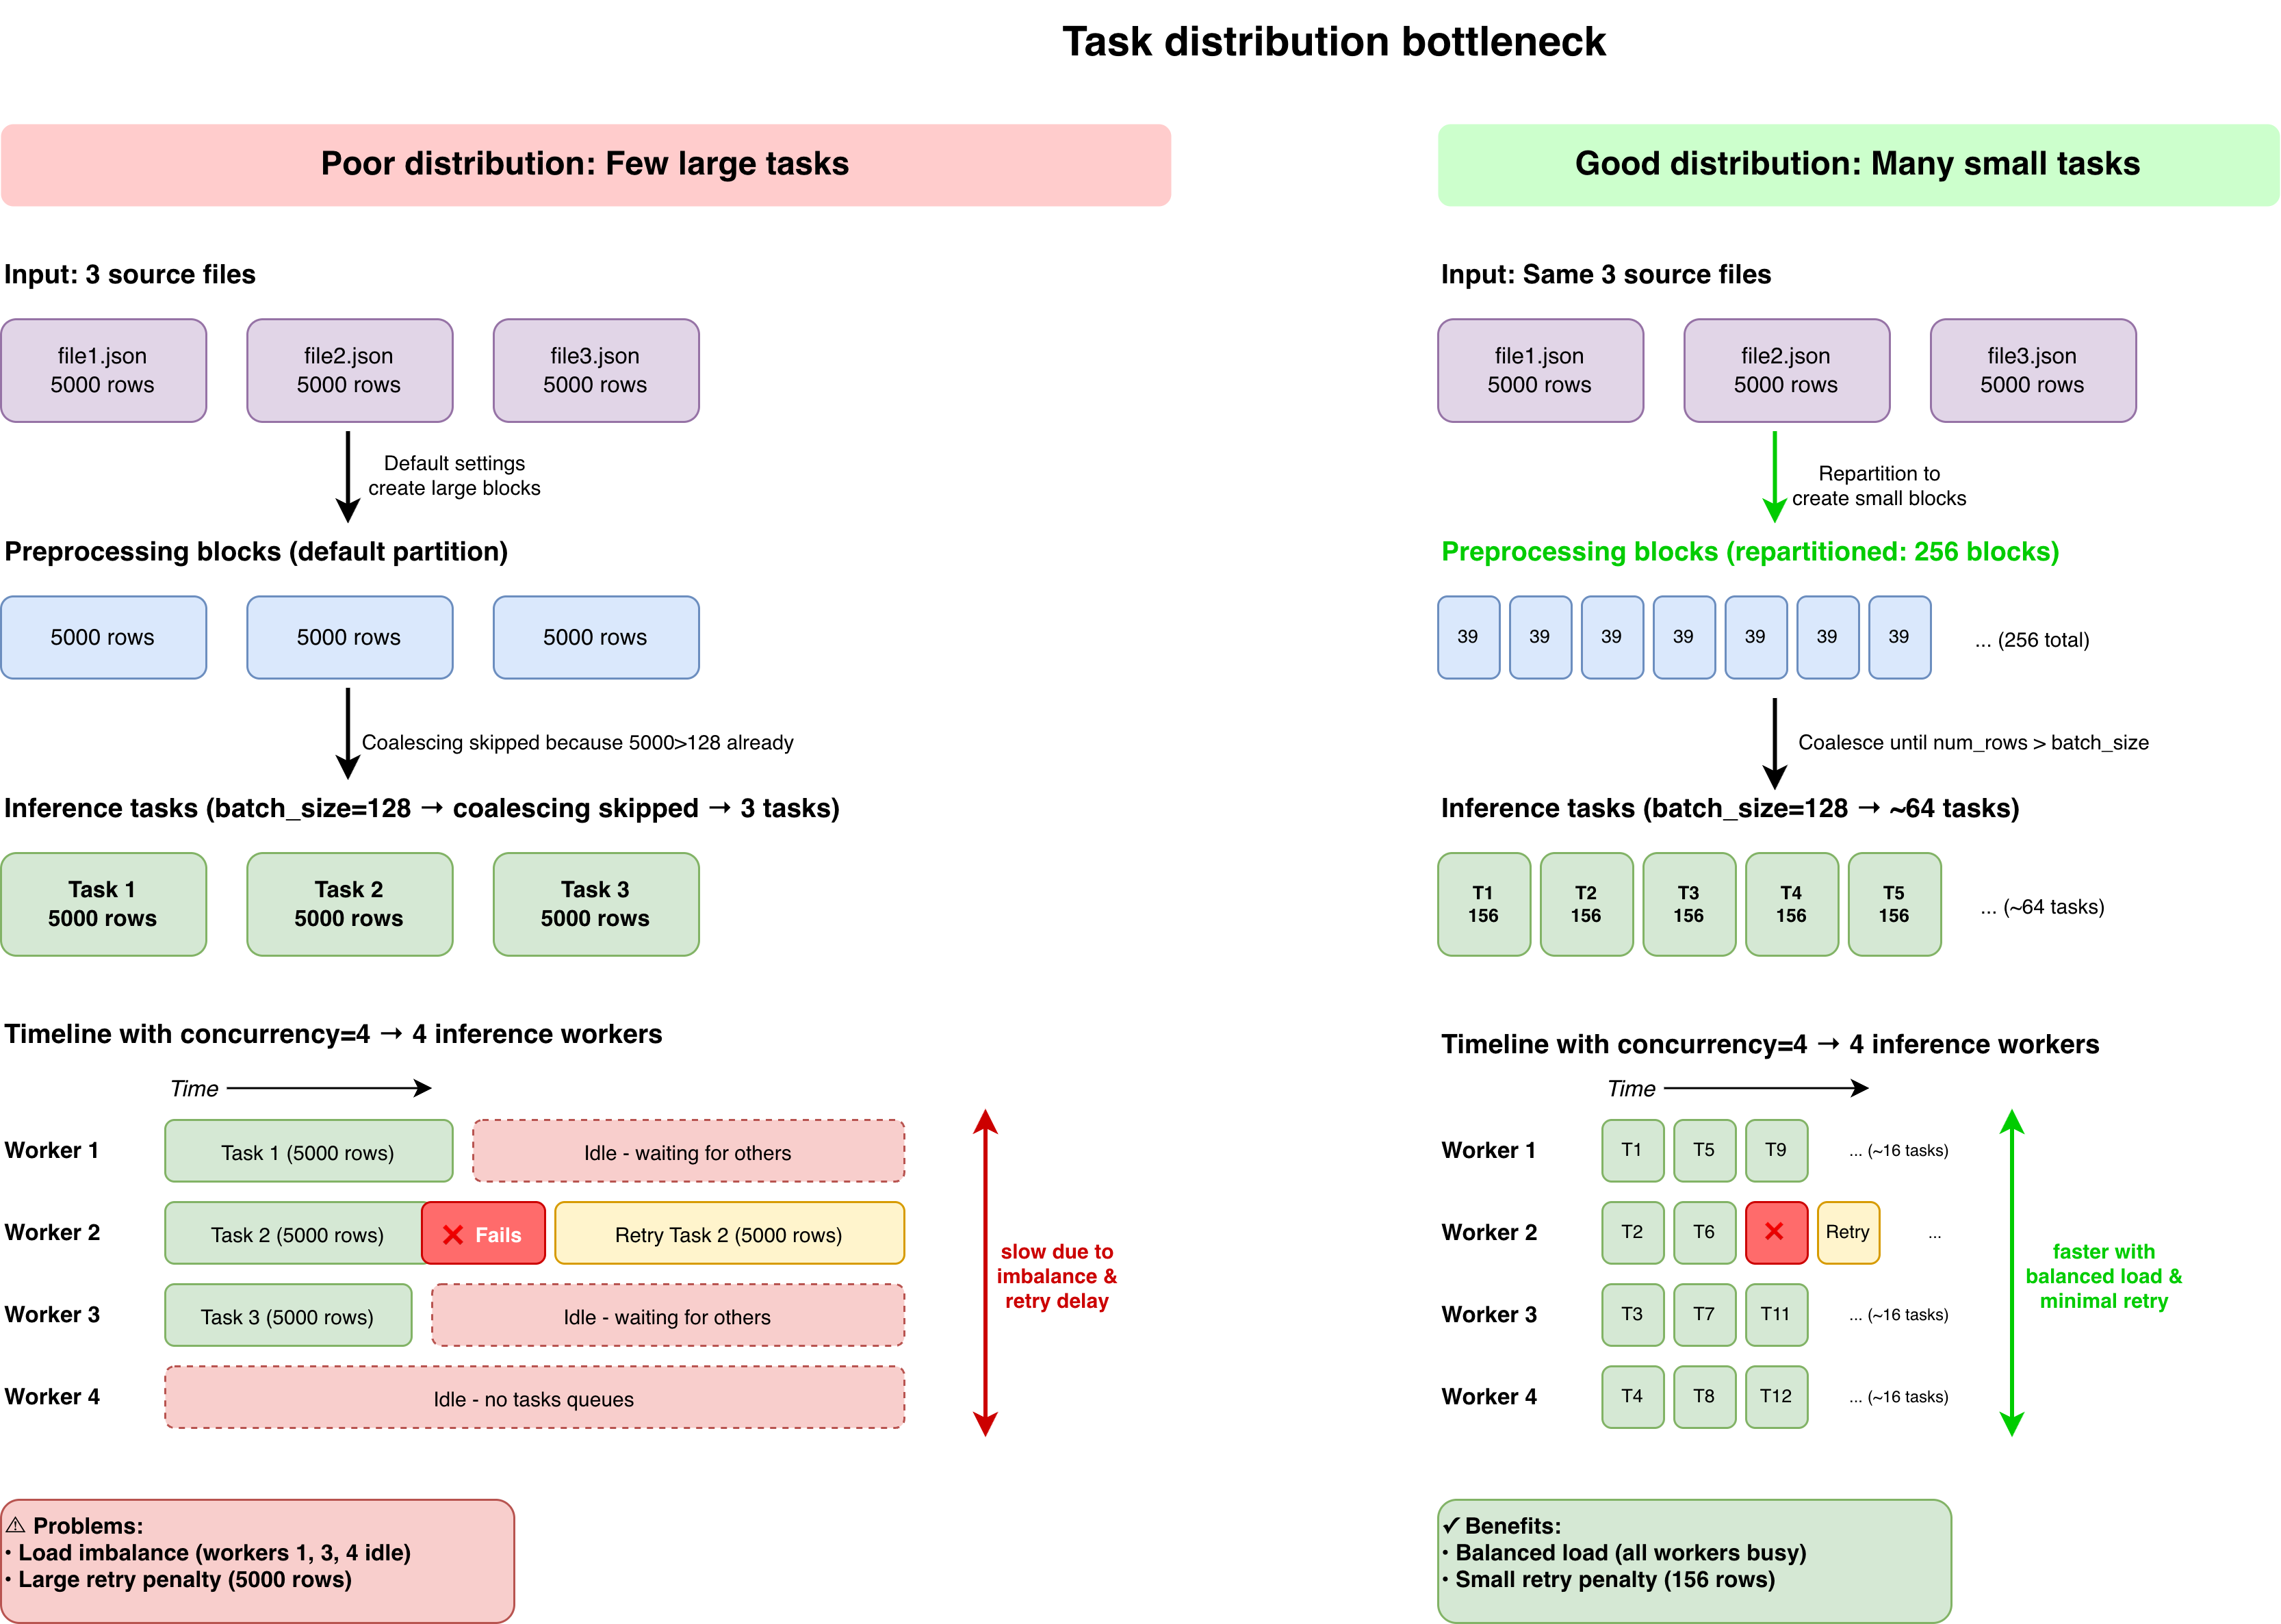
Worker saturation bottleneck
This bottleneck occurs when your dataset isn't properly partitioned into tasks, resulting in poor load balancing and insufficient work to keep all inference workers busy.
- The primary issue is uneven work distribution, where some workers sit idle while others process large tasks, leading to low GPU utilization despite available capacity.
- Reading from few large files with default settings often creates large preprocessing blocks, which translate into oversized inference tasks with poor parallelism.
- Worker failures require reprocessing entire large tasks, reducing fault tolerance and overall throughput.
- Insufficient task granularity becomes more pronounced when scaling out with more workers. Each worker needs enough tasks in its queue to maintain continuous processing.
To optimize, repartition your dataset into smaller blocks and configure appropriate batch_size and max_concurrent_batches to create well-distributed tasks. This ensures all workers stay busy and minimizes reprocessing delays on failures. Use batch_size to control task granularity and increase concurrency to scale horizontally across more GPUs. See Optimize task distribution and Scale with parallelism for detailed guidance.
GPU memory bottleneck
This bottleneck occurs when GPU memory constraints limit the number of concurrent sequences the vLLM engine can process, reducing overall throughput.
- The primary constraints are model weights, KV cache for concurrent sequences, and activation memory during prefill.
- Unlike online serving where you optimize for latency, batch inference benefits from maximizing concurrent sequence processing to achieve higher aggregate throughput.
- Memory exhaustion causes out-of-memory (OOM) errors that halt processing.
To optimize, match your context length requirements to your actual workload rather than using model defaults, and leverage quantization to reduce memory footprint. For advanced tuning, vLLM provides engine parameters to control memory allocation, but defaults work well for most workloads. See Optimize memory utilization and Apply quantization for detailed guidance.
Optimize task distribution
Proper task distribution is the foundation of efficient batch inference. Ray Data LLM processes your dataset by creating tasks that distribute to inference workers. The goal is to create enough fine-grained tasks for good load balancing and fault tolerance.
Repartition preprocessing blocks
When reading data, especially from few large files, repartition to create smaller blocks. This prevents Ray Data LLM from creating oversized inference tasks:
# dataset_size = 10,000 rows
# Problem: Reading from a single file can create 1 large block by default
ds = ray.data.read_json("storage://bucket/data/")

# Solution: Repartition to create smaller, manageable blocks
ds = ds.repartition(num_blocks=256)
# rows_per_preprocessing_block = 10,000 / 256 ≈ 39 rows
For detailed formulas on how Ray Data LLM creates tasks, see Adjust inference task distribution.
Configure batch size
The batch_size parameter controls how many rows Ray Data LLM groups into each inference task. Smaller values create more tasks for better load balancing and fault tolerance.
The max_concurrent_batches parameter controls how many tasks can queue simultaneously in each worker's input queue. This allows multiple batches to wait while one processes, reducing idle time between tasks.
When configuring these parameters, maintain this relationship to ensure the vLLM engine scheduler has enough concurrent work:
batch_size × max_concurrent_batches ≥ max_num_seqs
Where max_num_seqs is a vLLM engine parameter controlling concurrent sequence capacity in the vLLM scheduler. Ray Data LLM automatically warns if it detects potential under-saturation and provides guidance on adjusting these parameters.
processor = build_processor(
    config=vLLMEngineProcessorConfig(
        ...
        batch_size=128,  # Controls inference task size
        max_concurrent_batches=4,  # Concurrent batches per worker
        engine_kwargs={
            "max_num_seqs": 256,  # vLLM concurrent sequences (128 × 4 = 512 ≥ 256)
        },
        concurrency=4, # Number of parallel inference workers. Requires 4 GPUs (1 per worker)
    ),
    ...
)
# Following example of previous section:
# With 256 preprocessing blocks of ~39 rows each:
# rows_per_inference_task = ceil(128 / 39) × 39 ≈ 156 rows
# Number of inference tasks ≈ 10,000 / 156 ≈ 64 tasks
# Tasks per inference worker = 64 / 4 = 16 tasks per worker
Monitor task distribution across workers using Ray Dashboard. If you see significant imbalances, reduce batch_size or increase repartitioning to create more fine-grained tasks.
If preprocessing blocks are larger than batch_size, Ray Data LLM ignores batch_size and uses the preprocessing block size instead. To ensure the actual batch size stays close to your desired value, keep preprocessing blocks smaller than batch_size. See Repartition preprocessing blocks for guidance
Scale with parallelism
Scaling throughput in LLM batch inference involves distributing work across multiple GPUs. Choose between data parallelism for models that fit on a single GPU, and model parallelism for larger models that require multiple GPUs.
Scale with data parallelism
For models that fit on a single GPU, scaling throughput is straightforward: increase the number of inference workers using the concurrency parameter. Each worker independently processes tasks from the queue.
config = vLLMEngineProcessorConfig(
    model_source="meta-llama/Llama-3.1-8B-Instruct",
    concurrency=8,  # Scale to 8 workers
    accelerator_type="L4",
)
# Throughput scales roughly linearly with concurrency for small models
When you increase concurrency, ensure your dataset generates sufficient tasks to keep all workers busy. Follow the task distribution principles from Optimize task distribution and adjust batch_size or repartitioning accordingly.
For example, if you double workers from 4 to 8 but keep the same batch_size, each worker receives half as many tasks. Reduce batch_size or repartition into more blocks to maintain saturation across all workers.
Scale with model parallelism
For models too large to fit on a single GPU, model parallelism splits the model across multiple GPUs. This is a memory-size-bound optimization rather than a throughput optimization.
Tensor parallelism splits model layers horizontally across GPUs and requires high-speed interconnects such as NVLink. Pipeline parallelism splits model layers vertically across stages and tolerates slower interconnects:
config = vLLMEngineProcessorConfig(
    model_source="meta-llama/Llama-3.1-70B-Instruct",
    accelerator_type="A100-80G",
    engine_kwargs={
        "tensor_parallel_size": 4,  # Split across 4 GPUs with NVLink
    },
)
With PCIe-only GPUs such as L4, T4, or A10G, avoid using tensor parallelism. Communication overhead severely hurts throughput. Favor data parallelism with concurrency instead.
For guidance on setting up model parallelism and selecting appropriate GPUs, see Model parallelism and NVLink interconnect specifications.
Optimize memory utilization
GPU memory directly impacts how many concurrent sequences vLLM can process, which affects overall throughput. Ray Data LLM and vLLM provide sensible defaults that work well for most workloads.
Match context length to workload
The vLLM parameter max_model_len defines the maximum sequence length (prompt + output). KV cache scales linearly with context length, so setting this to match your actual requirements allows more concurrent sequences:
config = vLLMEngineProcessorConfig(
    model_source="meta-llama/Llama-3.1-8B-Instruct",
    engine_kwargs={
        "max_model_len": 4096,  # Match actual workload needs instead of model's 128K capacity
    },
)
Analyze your dataset token distribution and set max_model_len to the P95 or P99 value. For example, if 95% of your sequences are under 2000 tokens, setting max_model_len=2048 frees significant memory for additional concurrent sequences.
Advanced vLLM tuning
For advanced users who need to squeeze additional performance, vLLM provides engine parameters to control memory allocation and scheduling.
Key vLLM parameters:
max_num_seqs: Controls concurrent sequence capacity in the vLLM scheduler. Defaults work well for most cases, but you can increase this value if GPU utilization remains low after optimizing task distribution. When increasing this, adjustbatch_sizeandmax_concurrent_batchesto maintain saturation.max_num_batched_tokens: Controls prefill batch size. Only adjust if encountering OOM during prefill for very large models (+100B parameters).gpu_memory_utilization: Controls fraction of GPU memory allocated to vLLM. Defaults to 0.90 for safety. Tune this value when encountering memory pressure from other processes running on your GPU.
For detailed information on GPU memory allocation, see GPU memory requirements.
Apply quantization
Quantization reduces model memory footprint by converting weights to lower precision formats. This allows more concurrent sequences or enables fitting larger models on the same hardware.
FP8 quantization typically reduces memory by approximately 50% compared to BF16, with minimal impact on output quality. For example, a 70B model requires ~140 GB in BF16 but only ~70 GB in FP8, effectively doubling the number of concurrent sequences you can process:
config = vLLMEngineProcessorConfig(
    model_source="facebook/opt-125m",
    accelerator_type="L4",
    engine_kwargs={
        "quantization": "fp8",  # Or "awq", "gptq", etc.
        "max_model_len": 8192,
    },
)
For detailed guidance on quantization methods and configuration, see Quantization for LLM batch inference.
Monitoring and measurement
Track key metrics throughout execution to identify optimization opportunities and measure the impact of configuration changes.
Ray Dashboard provides cluster-level metrics including node-level CPU and GPU utilization, memory usage, and resource allocation across your cluster. Access the Ray Dashboard to monitor overall cluster health and identify resource bottlenecks. On your console, navigate to your Job or Workspace and select the Ray Dashboard tab.
Ray Data Workloads for an overview of all datasets that have been running on your cluster, including execution times, throughput, and task distribution across workers. Use this dashboard to identify which stages of your pipeline are bottlenecks and verify even task distribution. On your console, navigate to your Job or Workspace and select the Ray Workloads tab.
Metrics tab in the Anyscale console for an exhaustive list of Ray Data metrics in a time-series view. This helps you understand performance characteristics over time. On your console, navigate to your Job or Workspace and select the Metrics tab.
Anyscale natively integrates the Metrics dashboard with Grafana. To view your metrics in a Grafana dashboard, click the View in Grafana tab.
Call the stats() function on your processed dataset to get detailed throughput metrics for each task in your pipeline:
processed = processor(ds).materialize()
stats = processed.stats()
print(stats)
The output includes execution time per operator, rows processed per second, and resource utilization. Look for stages with high execution time or low throughput to identify optimization opportunities.
Target average GPU utilization of +80% during inference. Monitor these key metrics:
- GPU utilization: Should exceed 80% during inference phases
- Tokens per second: Overall throughput of your pipeline
- Time to completion: Total job runtime
- Task distribution balance: Variance in task completion times across workers
Use these metrics to compare different configurations and identify the most effective approach for your workload.
Common optimization patterns
Apply these patterns to address common bottlenecks you may encounter during batch inference. Each pattern focuses on the core optimization levers: task distribution, worker parallelism, and memory management.
Low GPU utilization
When GPU utilization is low despite available capacity, first review task distribution in Ray Dashboard. If workers sit idle between tasks, reduce batch_size or increase repartitioning to create more tasks. If all workers have tasks but GPUs are still underutilized, consider increasing concurrency to add more workers.
If GPU utilization remains low after optimizing task distribution and scaling workers, consider adjusting vLLM engine parameters such as max_num_seqs or max_num_batched_tokens to allow the engine to process more concurrent sequences or larger prefill batches. See Advanced vLLM tuning for details.
Inference worker imbalance
When some workers finish early while others process for much longer, your tasks are too coarse-grained. Reduce batch_size to create more fine-grained tasks, or increase repartitioning to create more uniform preprocessing blocks. See Preprocessing task distribution for details.
Out of memory errors
When encountering OOM errors, first verify your context length settings match your workload. If you're using the model's maximum context length unnecessarily, reduce max_model_len in engine_kwargs to better fit your needs. You can also lower the KV cache requirements by reducing max_num_seqs. For persistent issues with large models, consider quantization.
Scaling to meet deadline
When processing takes longer than your target completion time, scale out horizontally by increasing concurrency. Ensure you maintain good task distribution by adjusting batch_size and max_concurrent_batches proportionally. If you double workers, halve batch_size or double repartitioning to maintain sufficient tasks per worker.