Ray Data dashboard
Ray Data dashboard
This page provides an overview of using the Ray Data dashboard in the Anyscale console to monitor and debug Ray Data workloads.
Access the Data dashboard
To access the Data dashboard, click the Ray Workloads tab in the Jobs or Workspaces page. Then, select the Data tab.
The dashboard is available only for Ray 2.44 and higher. It's empty for lower versions of Ray.
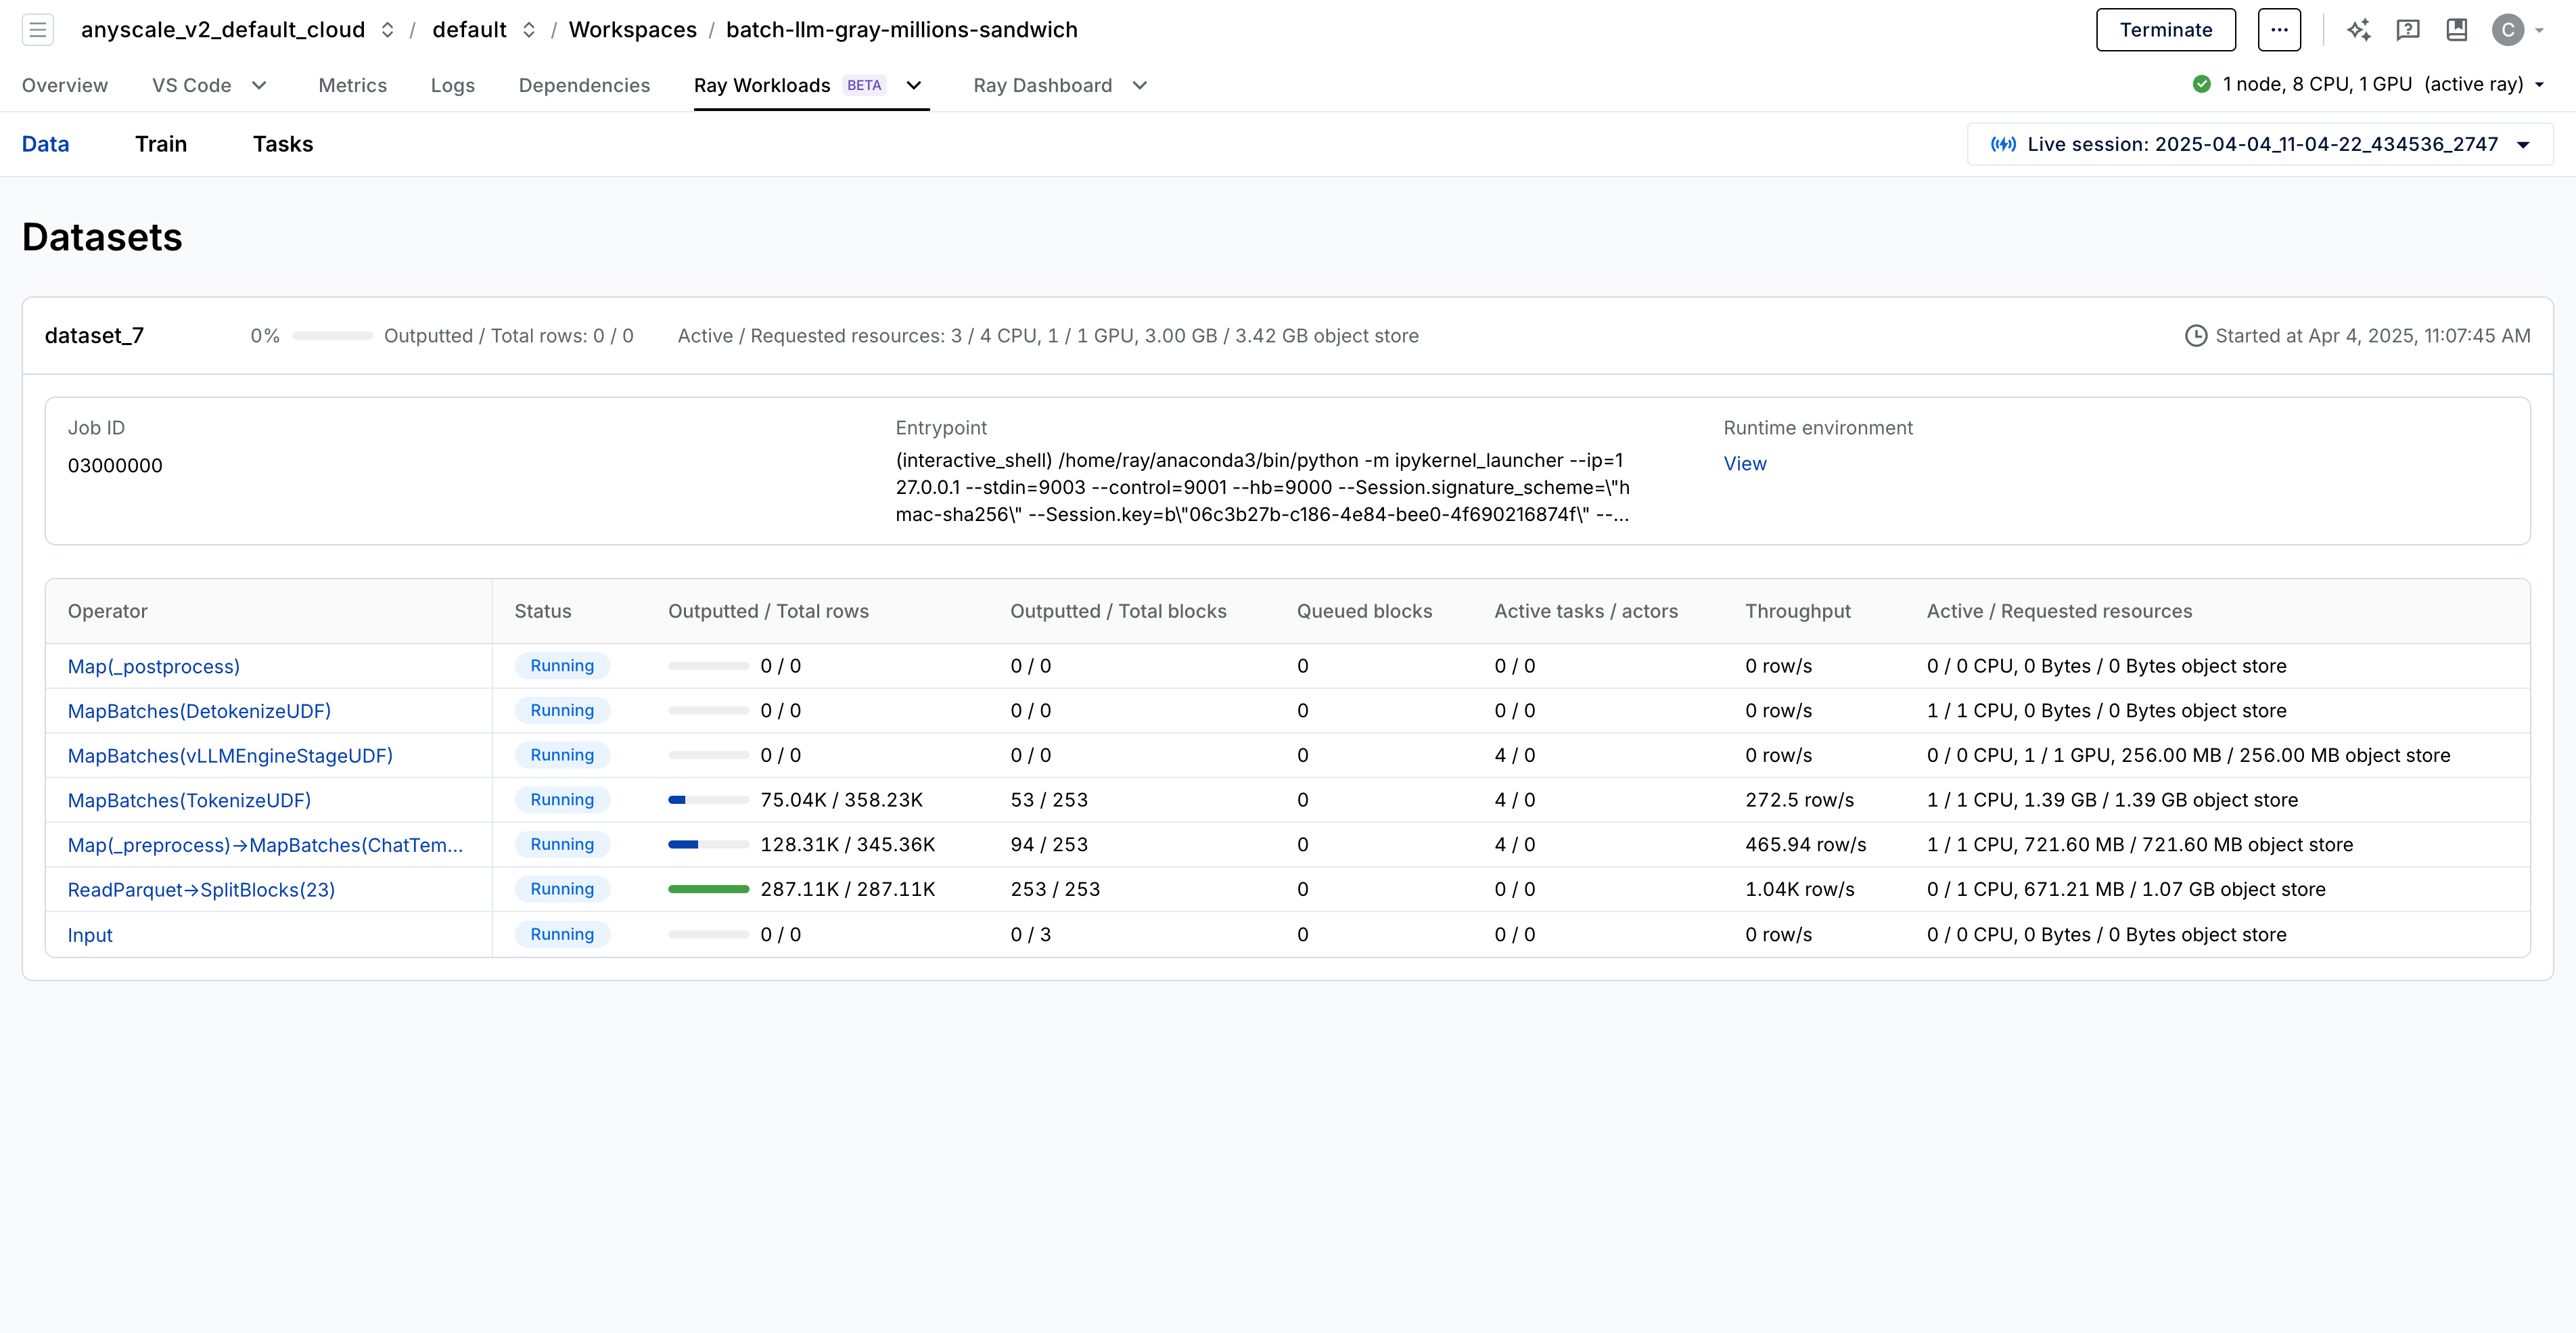
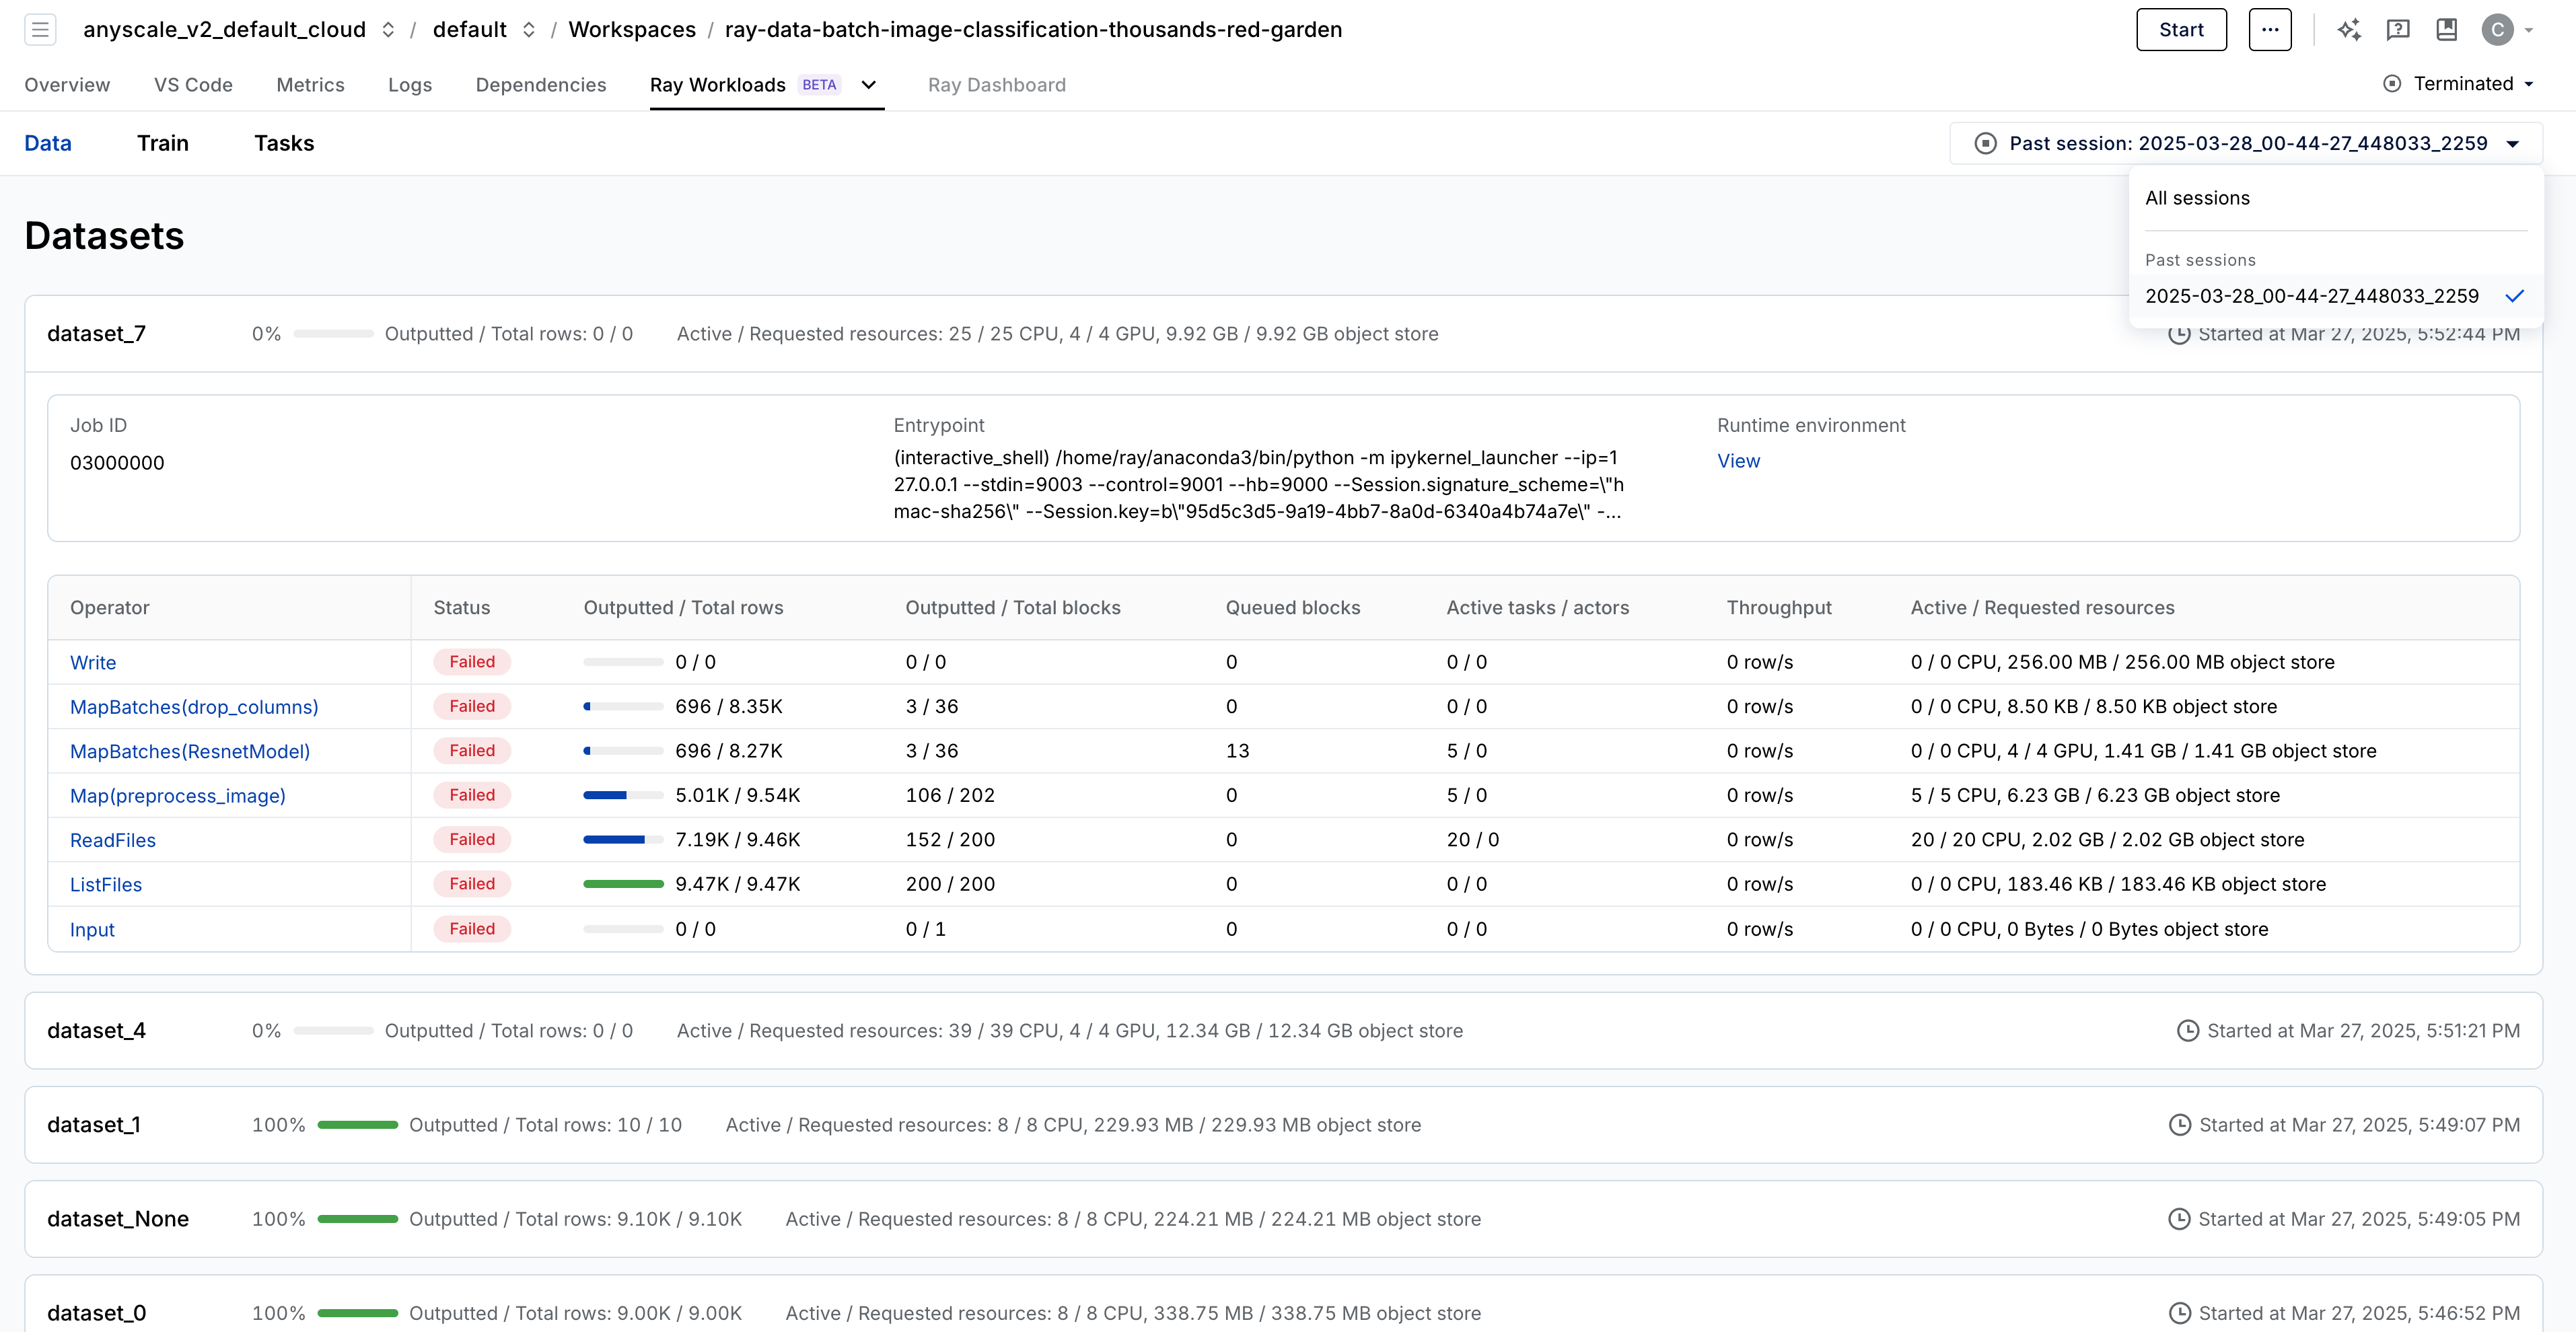
The dashboard offers a high-level overview of your entire workload pipeline, displaying key debugging metrics such as CPU and GPU usage, the number of output and queued rows, throughput, and more. Operators are listed in reverse order, with the first row representing the final output of the dataset and the last row representing the input. This design allows the UX to render the pipeline as a tree view, making it easier to visualize complex datasets.
View Ray Data operator details
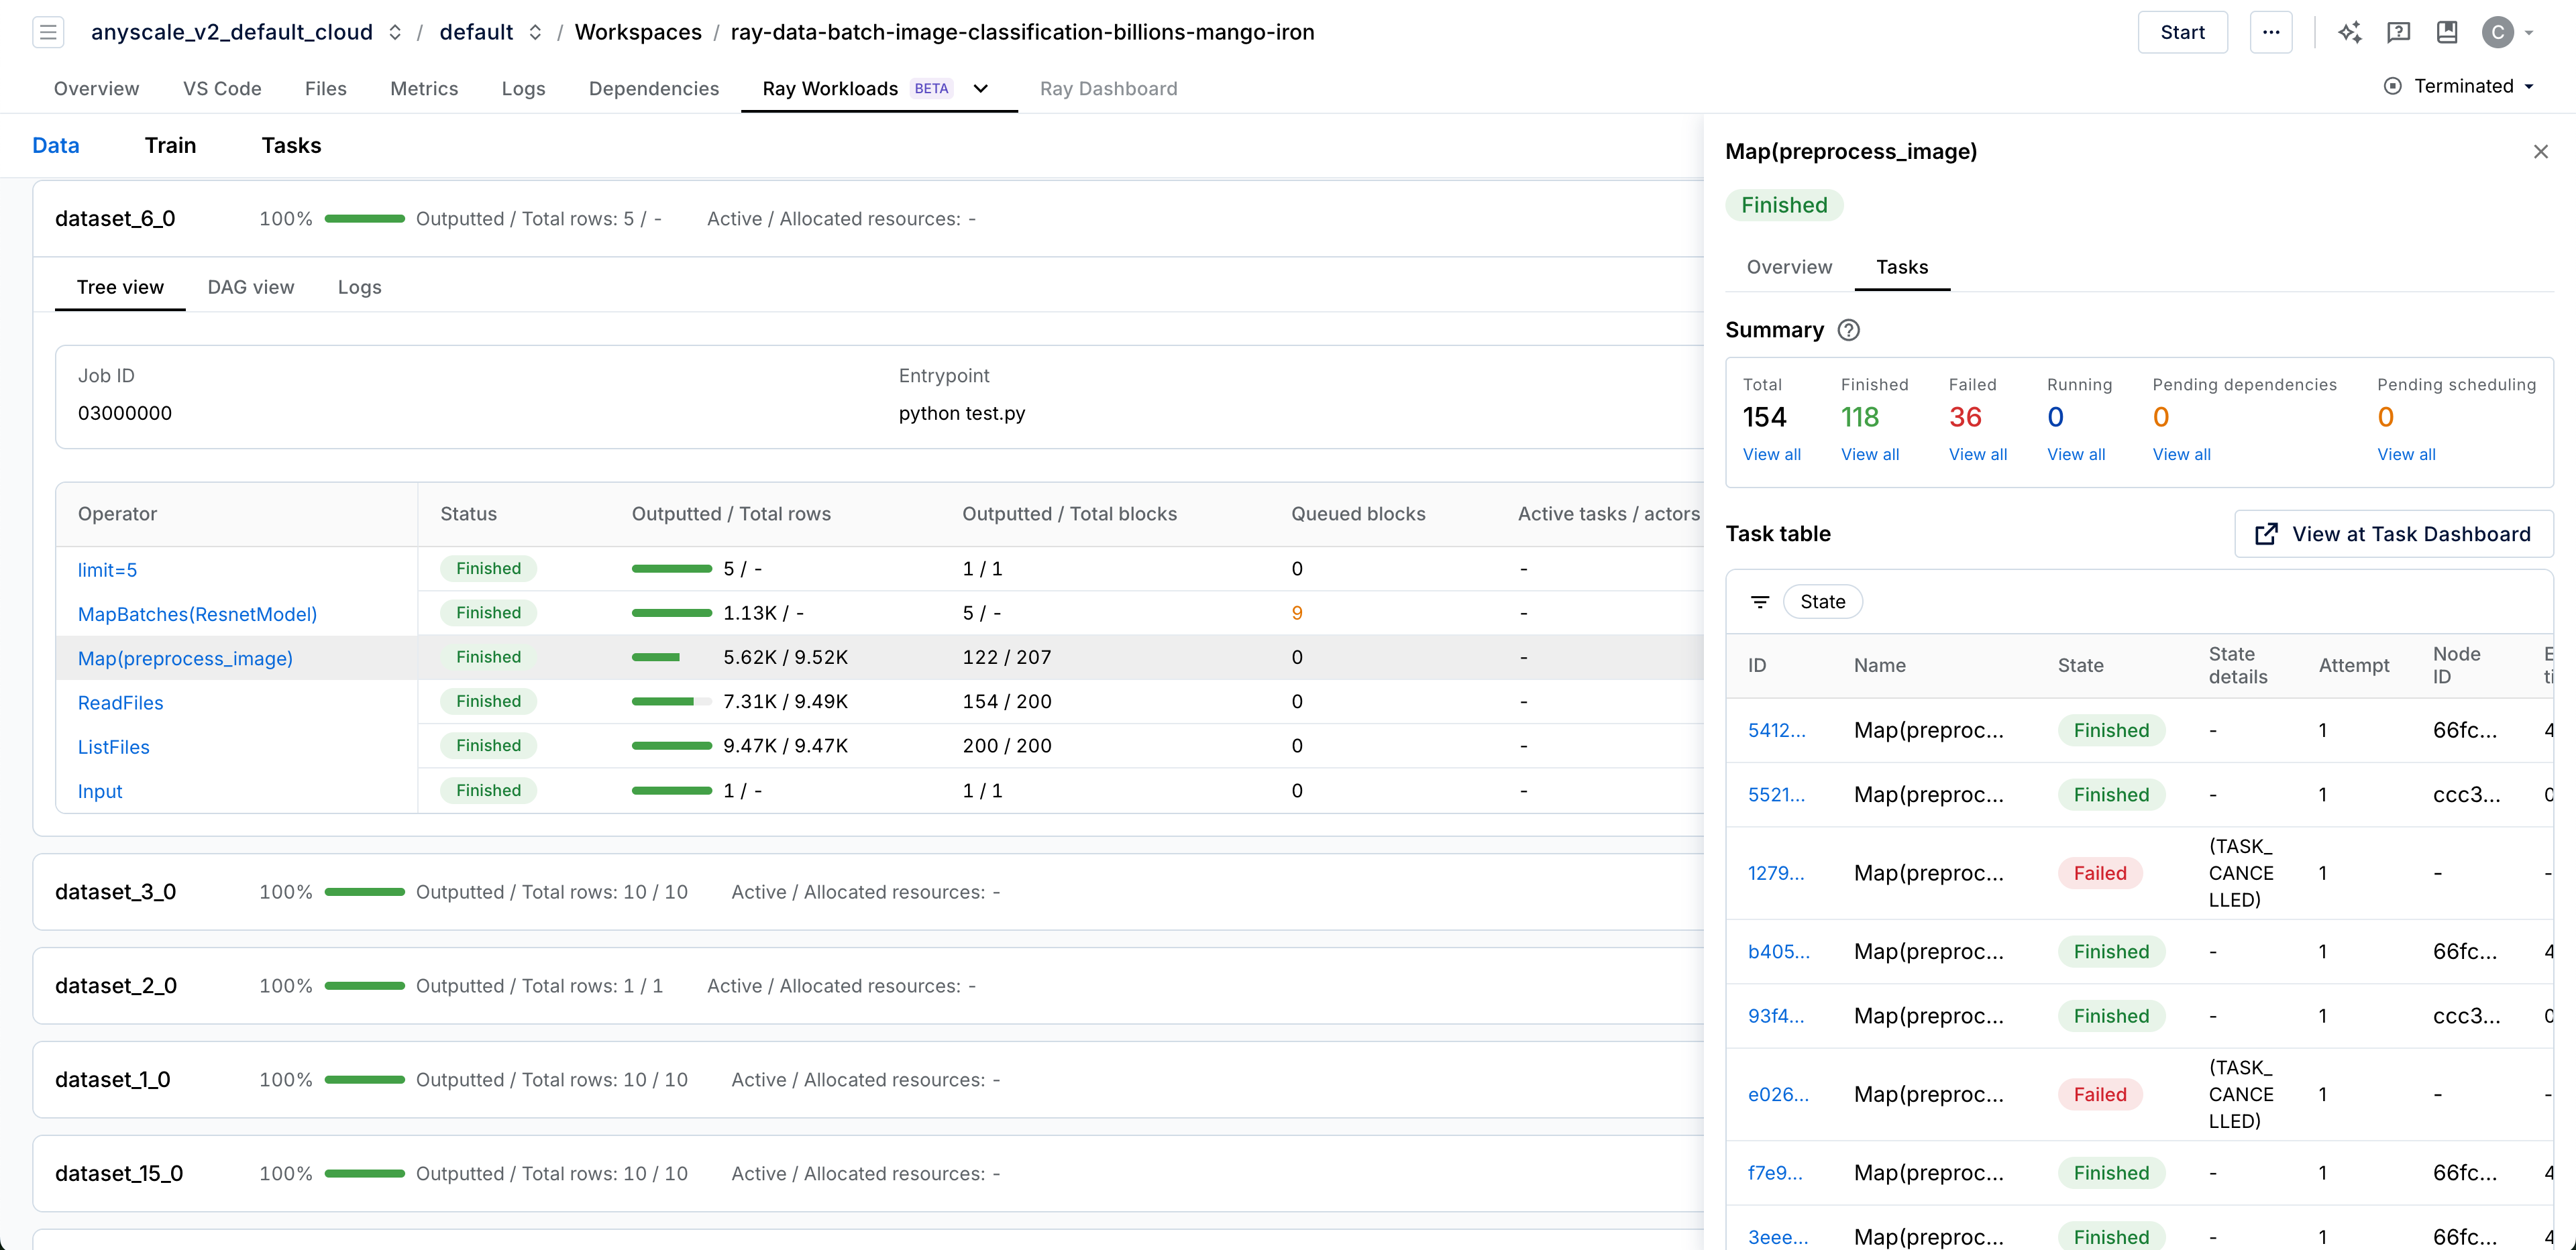
Click an individual operator to view operator-specific metrics. The Overview tab displays metrics including estimated remaining runtime and peak memory usage.
Click the Tasks tab to view task details for the operator, including summaries by state and state-based filtering.
The tasks tab for Ray Data operators provides a filtered view of the tasks dashboard. See Anyscale task dashboard.
Task dashboards require the system cluster, which has an associated cost. See System cluster.
All limitations and requirements for the task dashboard apply to the task tab. See Requirements and limitations.
Tree view
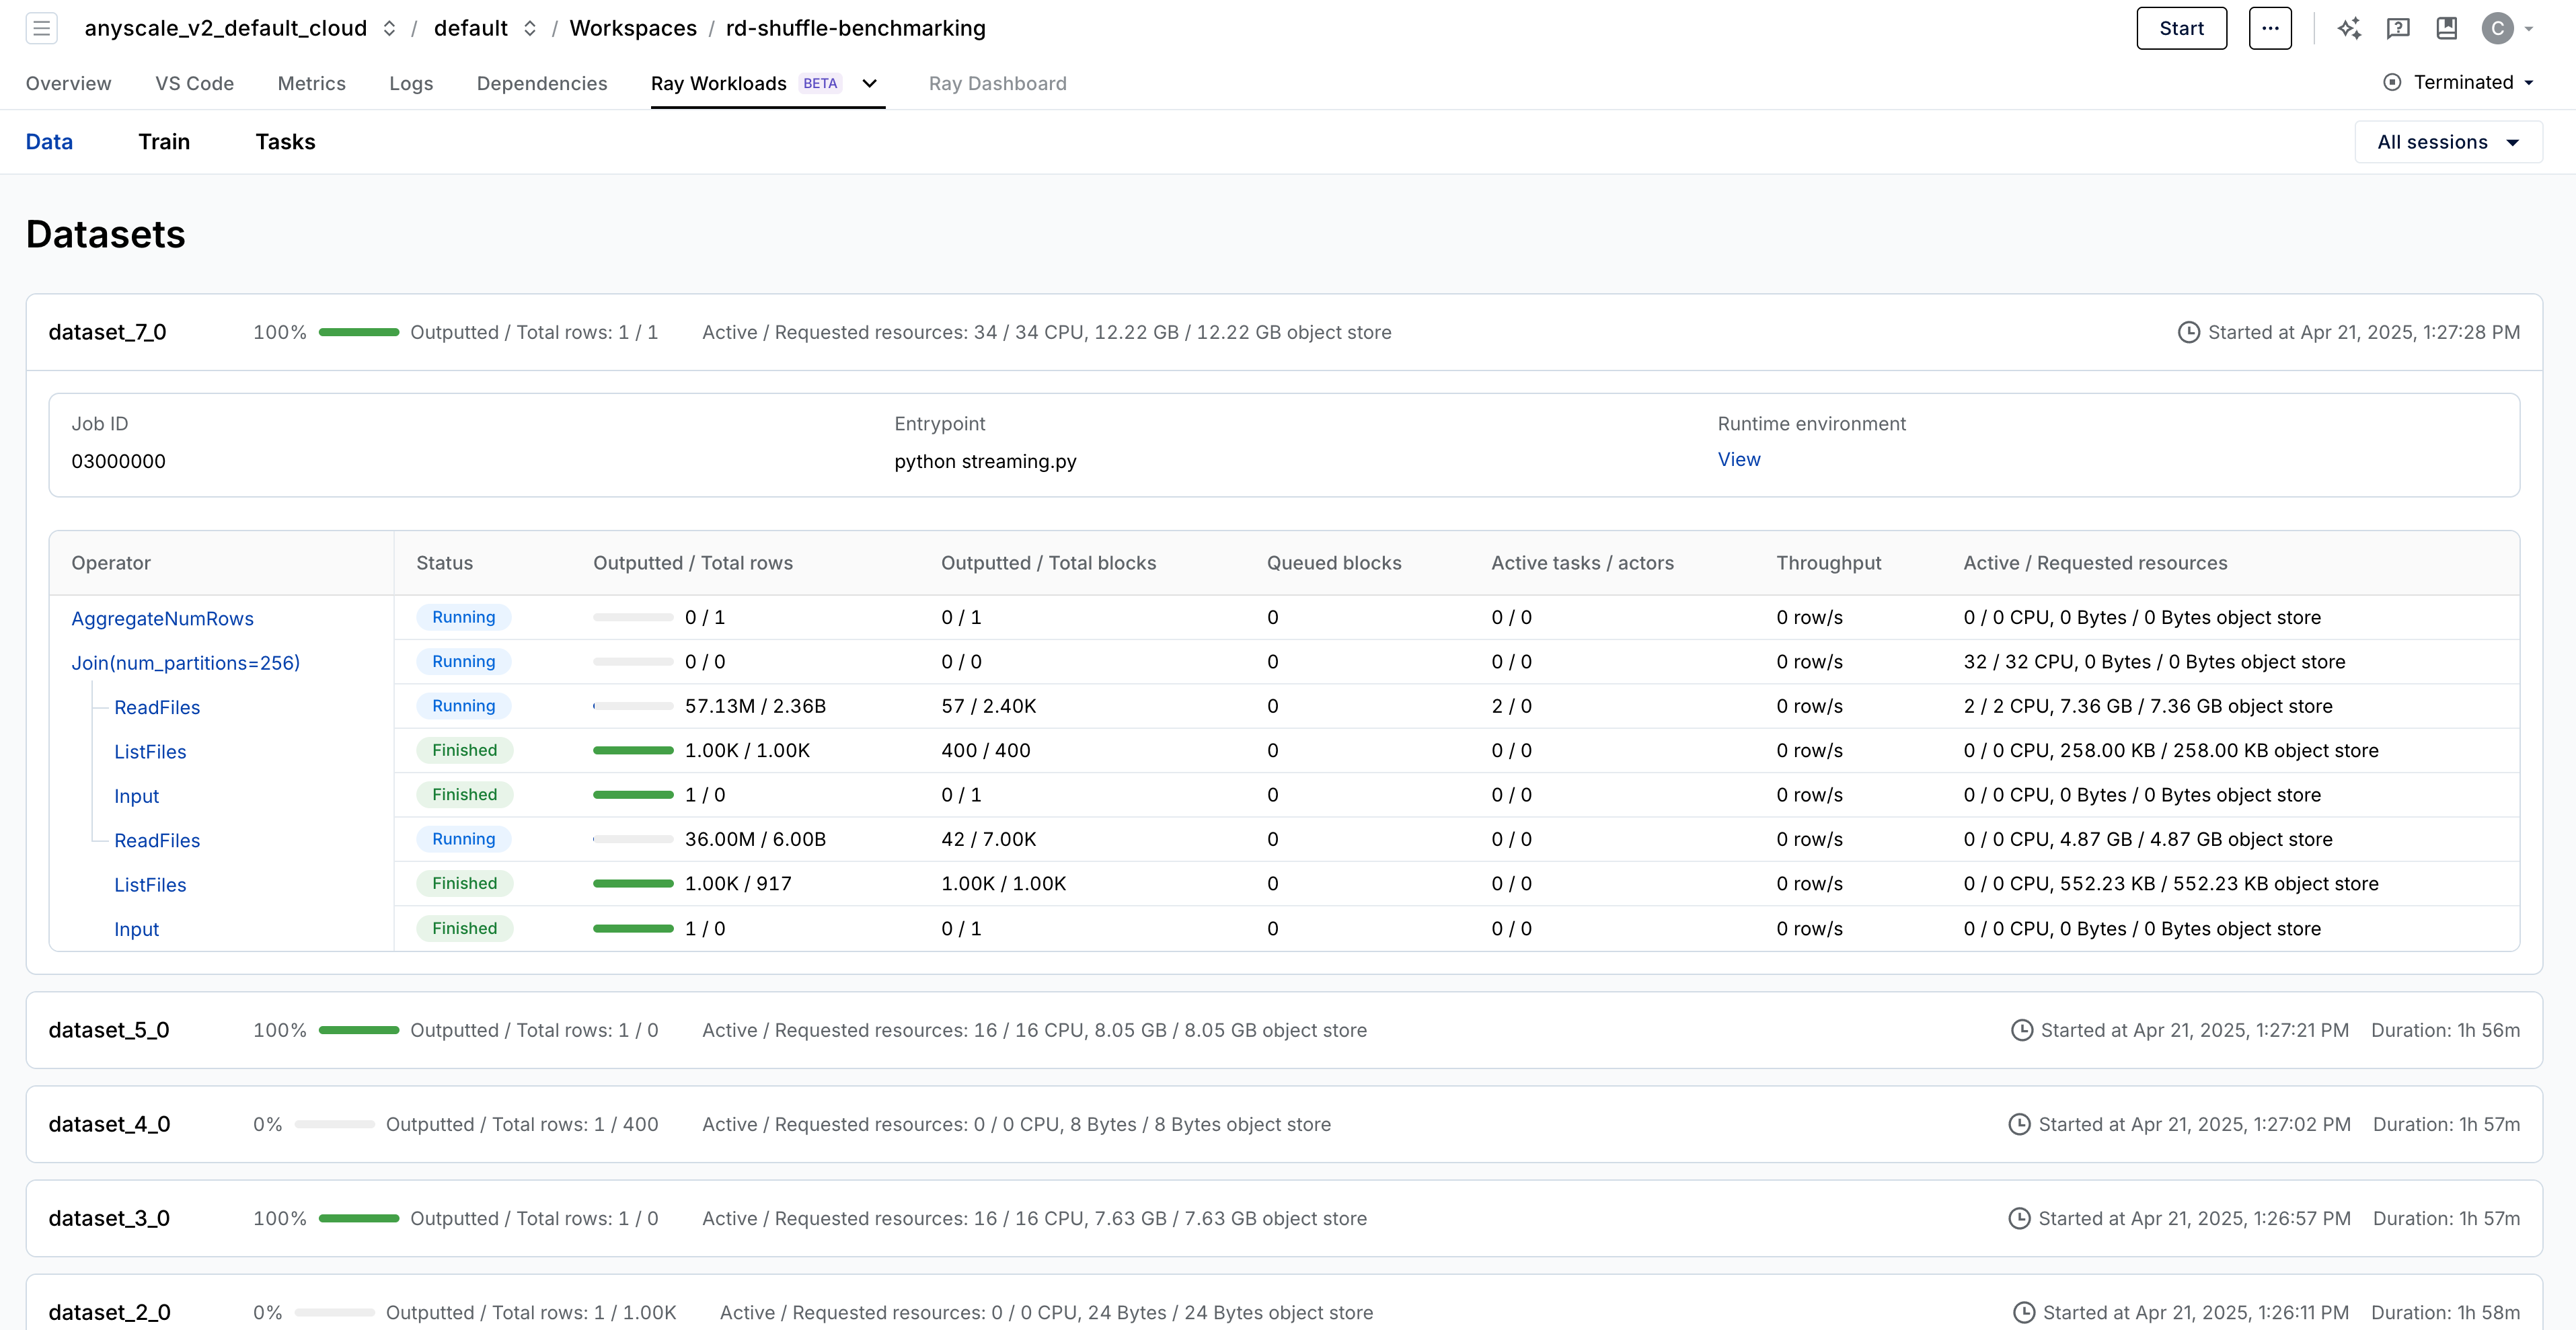
For pipelines with n-ary operators such as join, union, or zip, the dashboard visualizes the pipeline as a tree. This tree structure is crucial for understanding complex data workflows.
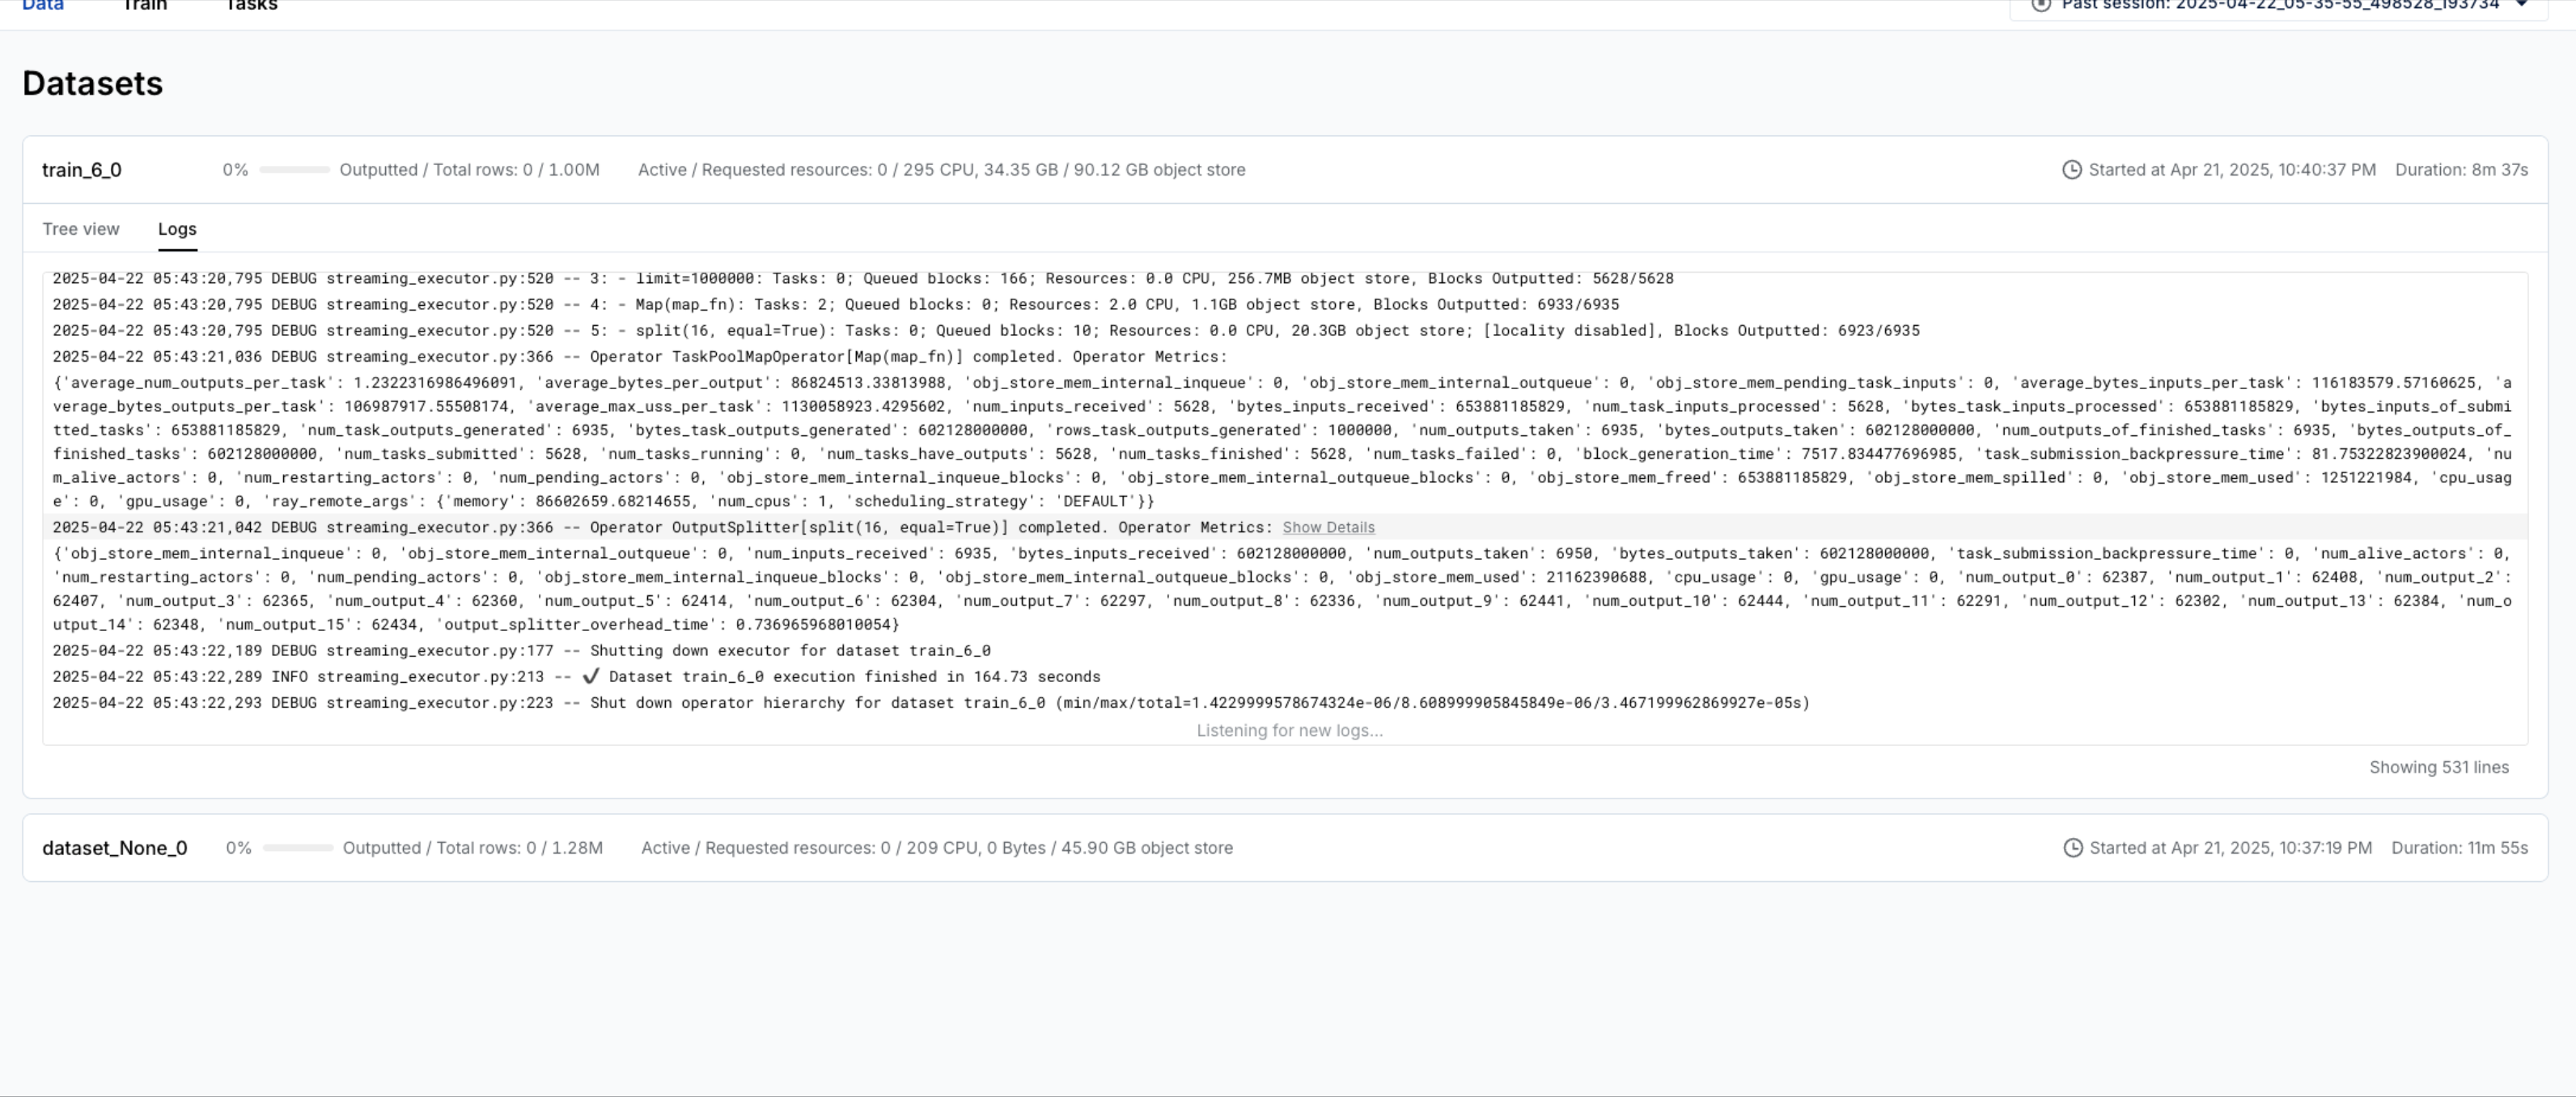
Log view
The Data dashboard includes a detailed log view for each dataset, capturing logs from /tmp/ray/{SESSION_NAME}/logs/ray-data/ray-data-{DATASET_ID}.log. By default, Ray Data generates a variety of useful logs, including details about backpressure, health checks, and failure events such as out-of-memory (OOM) errors.
You can also use this feature to emit logs from your own functions using the Ray Data logger. For example, the snippet below demonstrates how to log messages within a custom map function to selectively inspect dataset contents:
logger = logging.getLogger("ray.data")

def my_map_function(batch):
  if is_interesting(batch):
    logger.info(f"Processing {batch}")
  ...
Persistence
The Data dashboard remains available even after you terminate a job or workspace. By selecting a past session from the Session dropdown in the top-right corner, you can access historical data and continue debugging as needed.