Train dashboard
Train dashboard
The Train dashboard streamlines the debugging of Ray Train workloads. This dashboard enables you to gain deeper insights into individual workers' progress, pinpoint stragglers, and identify bottlenecks for faster, more efficient training.
This dashboard should be the starting point for debugging any issue with your Train workload. It links to other pages of the Anyscale dashboard for more detailed information about the workload, such as logs, metrics, tasks, actors, or nodes.
Access the dashboard
To access Train workload dashboards, click the Workloads tab in the Jobs or Workspaces page. Then, select the Train tab.
The Train dashboard presents information in a hierarchy, with groupings of sessions, runs, attempts, and workers.
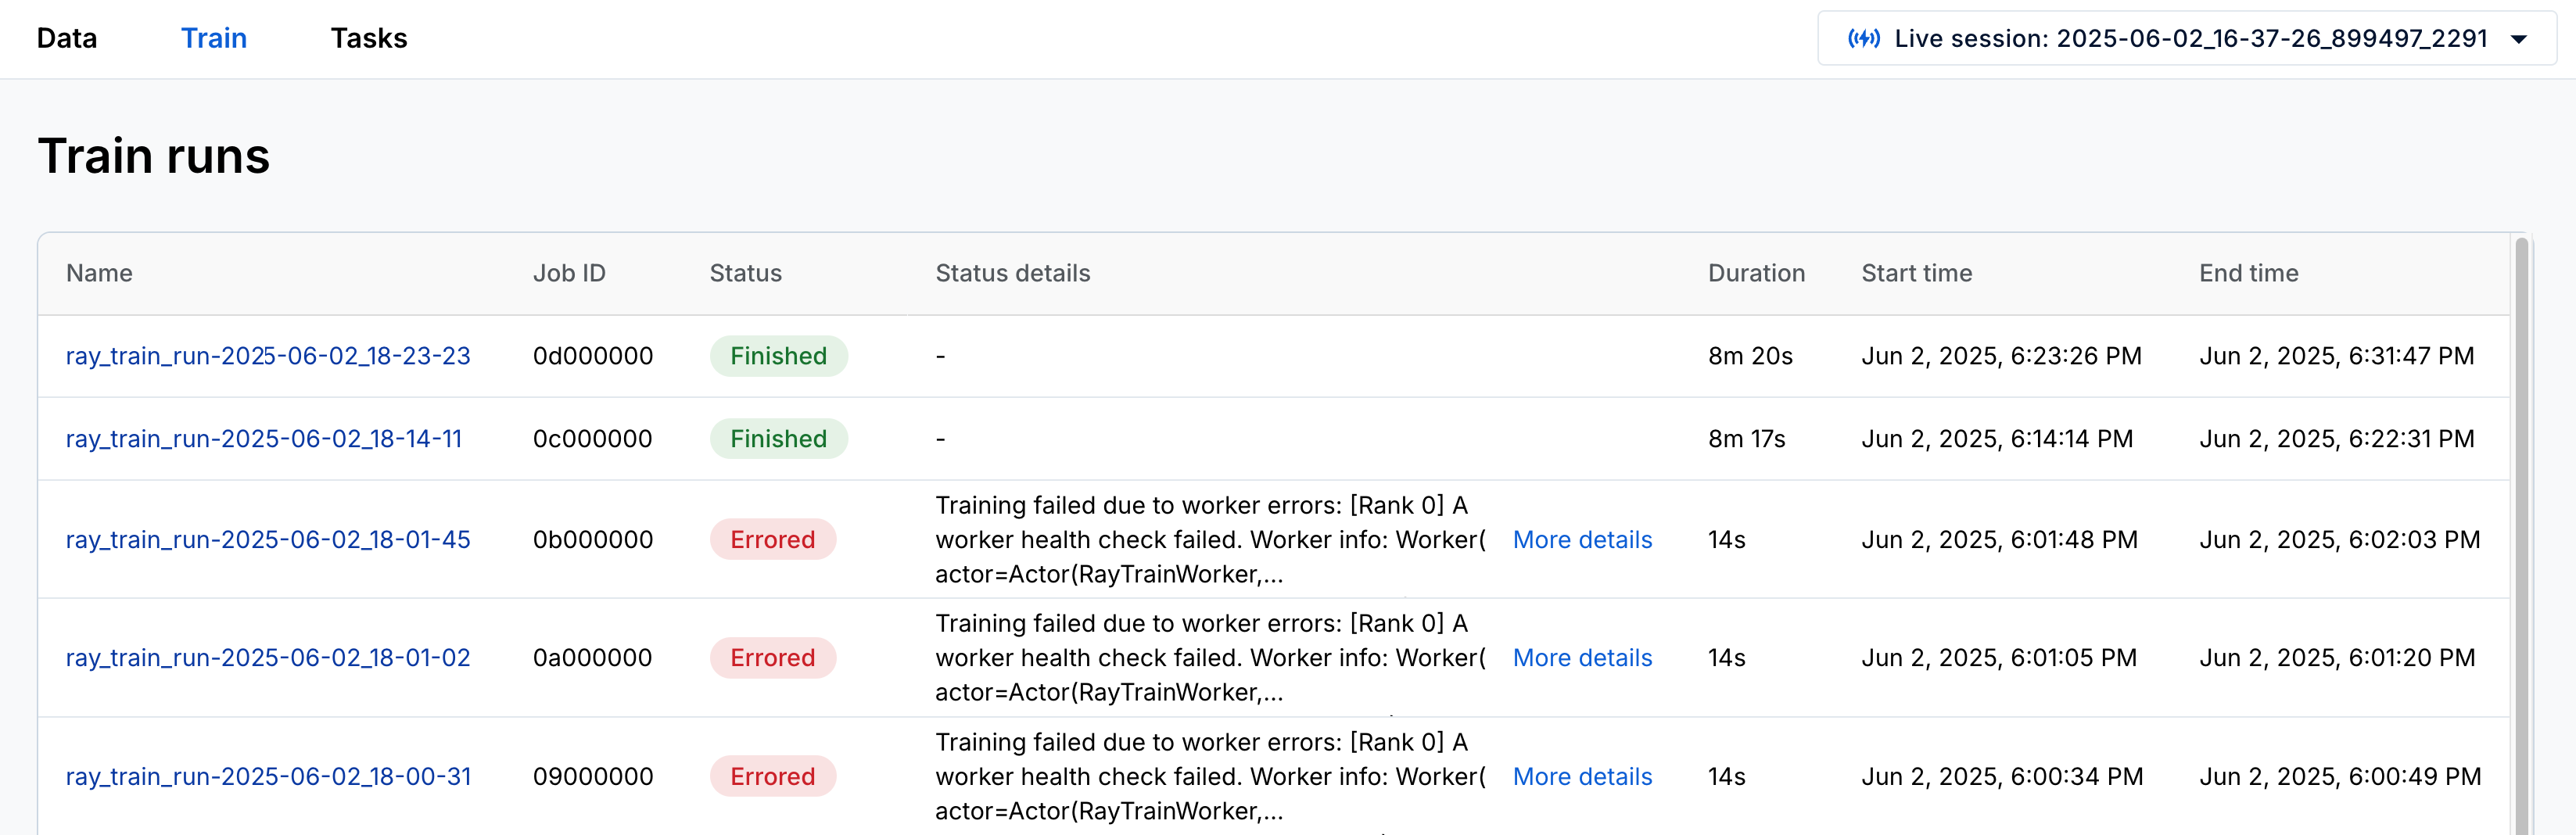
Monitor a Train run
Each run corresponds to a single call to trainer.fit() and represents a unique training execution.
The following table describes the fields displayed for each run:
| Field | Description |
|---|---|
| ID | The unique ID of a Train run. |
| Name | The run name set using the ray.train.RunConfig(name) configuration. |
| Status | The current state of the Train run, for example, INITIALIZING, RUNNING, or ERRORED. |
| Status Details | Additional info, such as stack traces if the run failed. |
| Controller Info | Actor ID and logs for the controller managing the run. |
The Train dashboard home page shows a list of runs from the current Ray session. Navigate to an individual run page by clicking on the row that you want to inspect.
Debug Train runs with controller logs
Each run spawns a controller, which is a dedicated actor with the following responsibilities:
- Spawns and monitors workers
- Handles failure recovery
- Logs global information including failure handling and scheduling decisions, which you can view in the run page
Error attribution and debugging
When training jobs fail, the Train dashboard provides rich context to help you quickly diagnose and address the root cause. The dashboard automatically surfaces detailed information about failures, eliminating the need to manually piece together logs from different systems.
For each failure, use the dashboard to identify the following:
- Specific workers affected: Identify which worker processes encountered errors
- Error classification: Distinguish between application errors—bugs in your training code—and hardware issues, such as GPU failures or out-of-memory conditions
- Detailed stack traces: View complete error stack traces directly in the run's Status Details field
- Relevant node logs: Access system-level logs that show hardware-related issues such as GPU errors or memory problems
- Historical context: When using fault tolerance or elastic training, view error details from previous attempts to understand patterns
The dashboard marks failed runs as ERRORED and provides status details explaining where the error originated. Individual workers also display their own status details, including relevant node logs when hardware failures occur.
This comprehensive error context enables faster debugging by providing all relevant information in a single interface, reducing the time spent searching through scattered logs and metrics.
View the history of Train run attempts
Each run begins as a first run attempt. The run moves on to a new attempt when:
- You configure Ray Train worker fault tolerance, and the run retries after encountering a worker failure.
- You enable elastic training, and the worker group scales up or down.
The following table describes the fields displayed for each attempt:
| Field | Description |
|---|---|
| Attempt # | Attempt index within a run |
| Status | State of the attempt, for example, SUCCEEDED, ERRORED, or RUNNING |
| Status details | Additional information about the attempt (for example, the error that caused the attempt to fail) |
The run page lists attempts at the bottom, with the most recent attempt at the top.
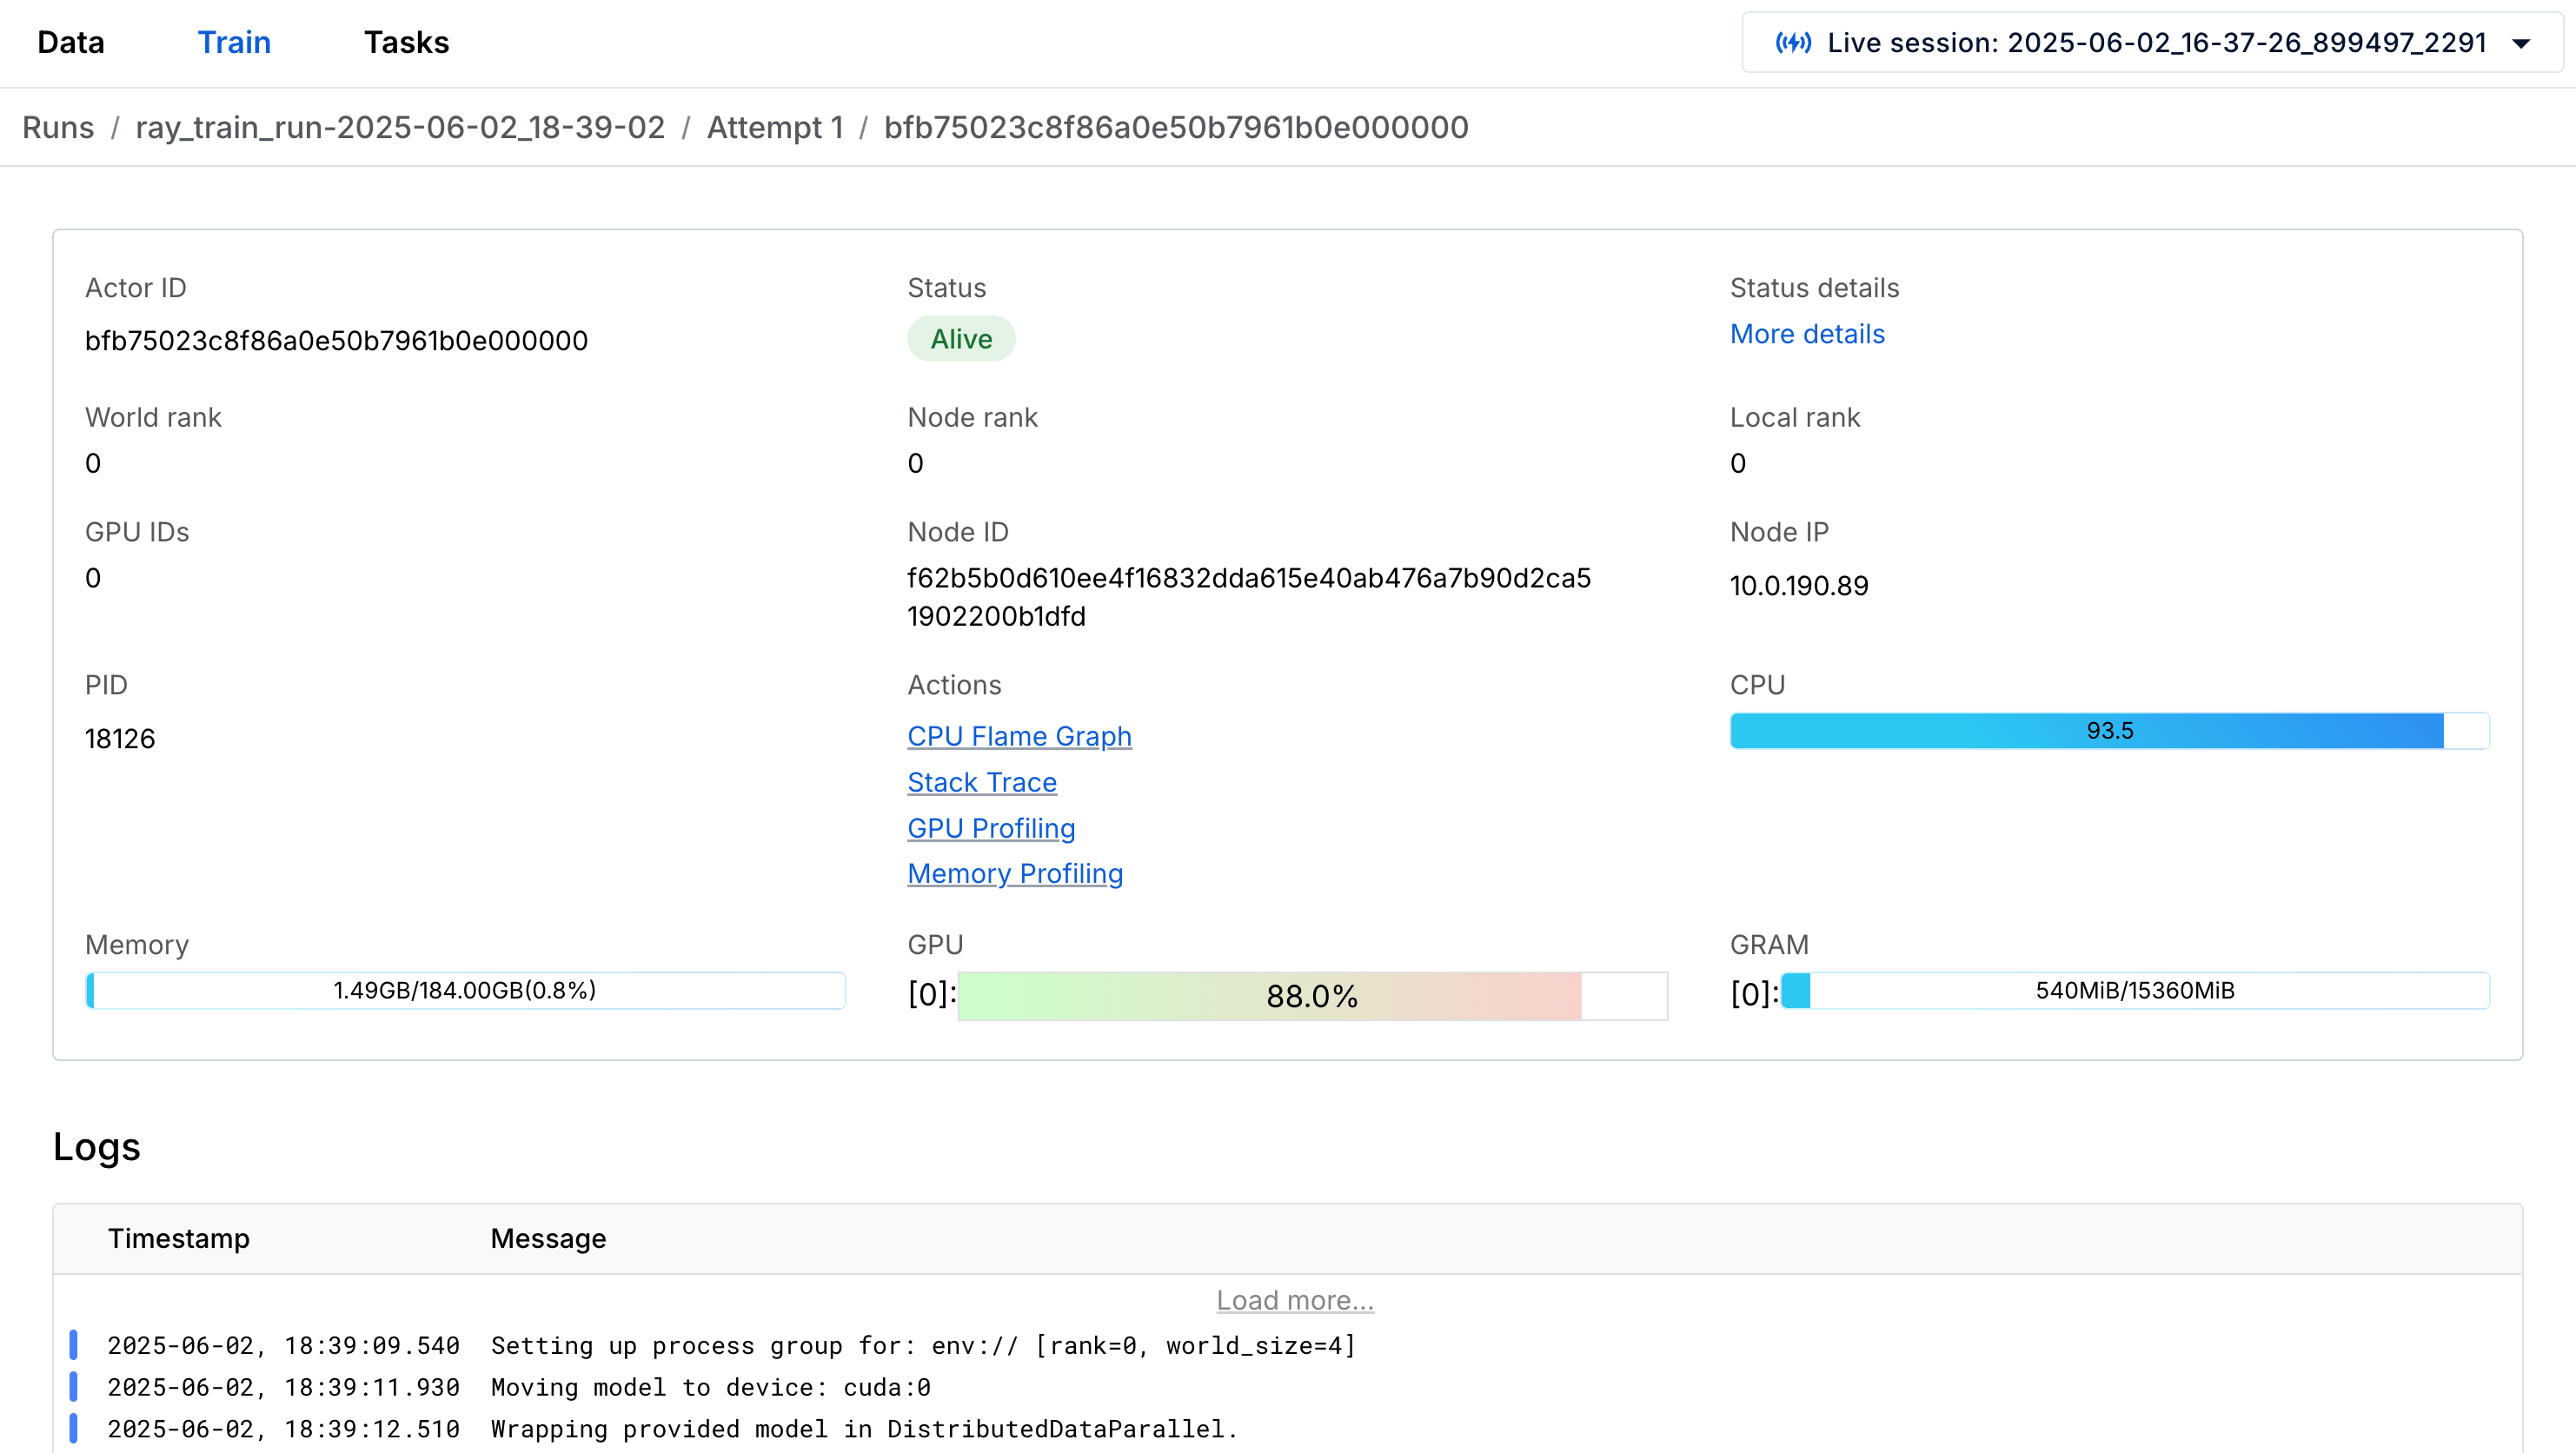
Inspect worker logs and metadata
Each attempt consists of a group of workers executing the user-defined distributed training code.
The following table describes the fields displayed for each worker:
| Field | Description |
|---|---|
| Actor ID | Unique Ray actor ID for the worker process |
| Status | Process status (ALIVE, DEAD) |
| World Rank | Index of the worker within the group |
| Local Rank | Index among workers on the same node (matches GPU ID if applicable) |
| Node Rank | Index of the node running the worker |
| PID | Process ID |
| Node IP | IP address of the node running the worker |
Navigate to the training worker view by clicking on a worker link in a run attempt. Access worker logs, metrics, and profiling tools from here: