Train dashboard profiling tools
Train dashboard profiling tools
The Train dashboard integrates CPU and GPU profiling tools to help you identify performance bottlenecks in distributed training workloads. You can launch these profiling tools with a single click from the worker detail page.
On-demand CPU profiling
The Train dashboard allows you to take an on-demand CPU profile of a training run using py-spy, a sampling-based profiling tool that generates flame graphs and stack traces. Use CPU profiling to identify performance bottlenecks, such as slow data preprocessing, inefficient custom operators, or training code that's waiting on resources.
CPU profiling works by periodically sampling the training worker process to capture what code is executing. This sampling-based approach has minimal performance impact on your training job.
Collect a CPU profile
Complete the following steps to generate a CPU profile for your training worker:
- Navigate to an active Train run page.
- Click on a worker to view its detail page.
- Click the CPU Profiling button.
- Enter the profiling duration in the configuration window.
- Wait for profiling to finish. The profiling result generates a flame graph showing where CPU time is being spent.
The flame graph visualizes the call stack. The width of each bar represents the amount of CPU time that function consumes. Wider bars indicate functions consuming more CPU time, helping you quickly identify optimization opportunities.
For more information about interpreting flame graphs and using py-spy, see the py-spy documentation.
On-demand GPU profiling
This feature supports PyTorch 2.0 or later.
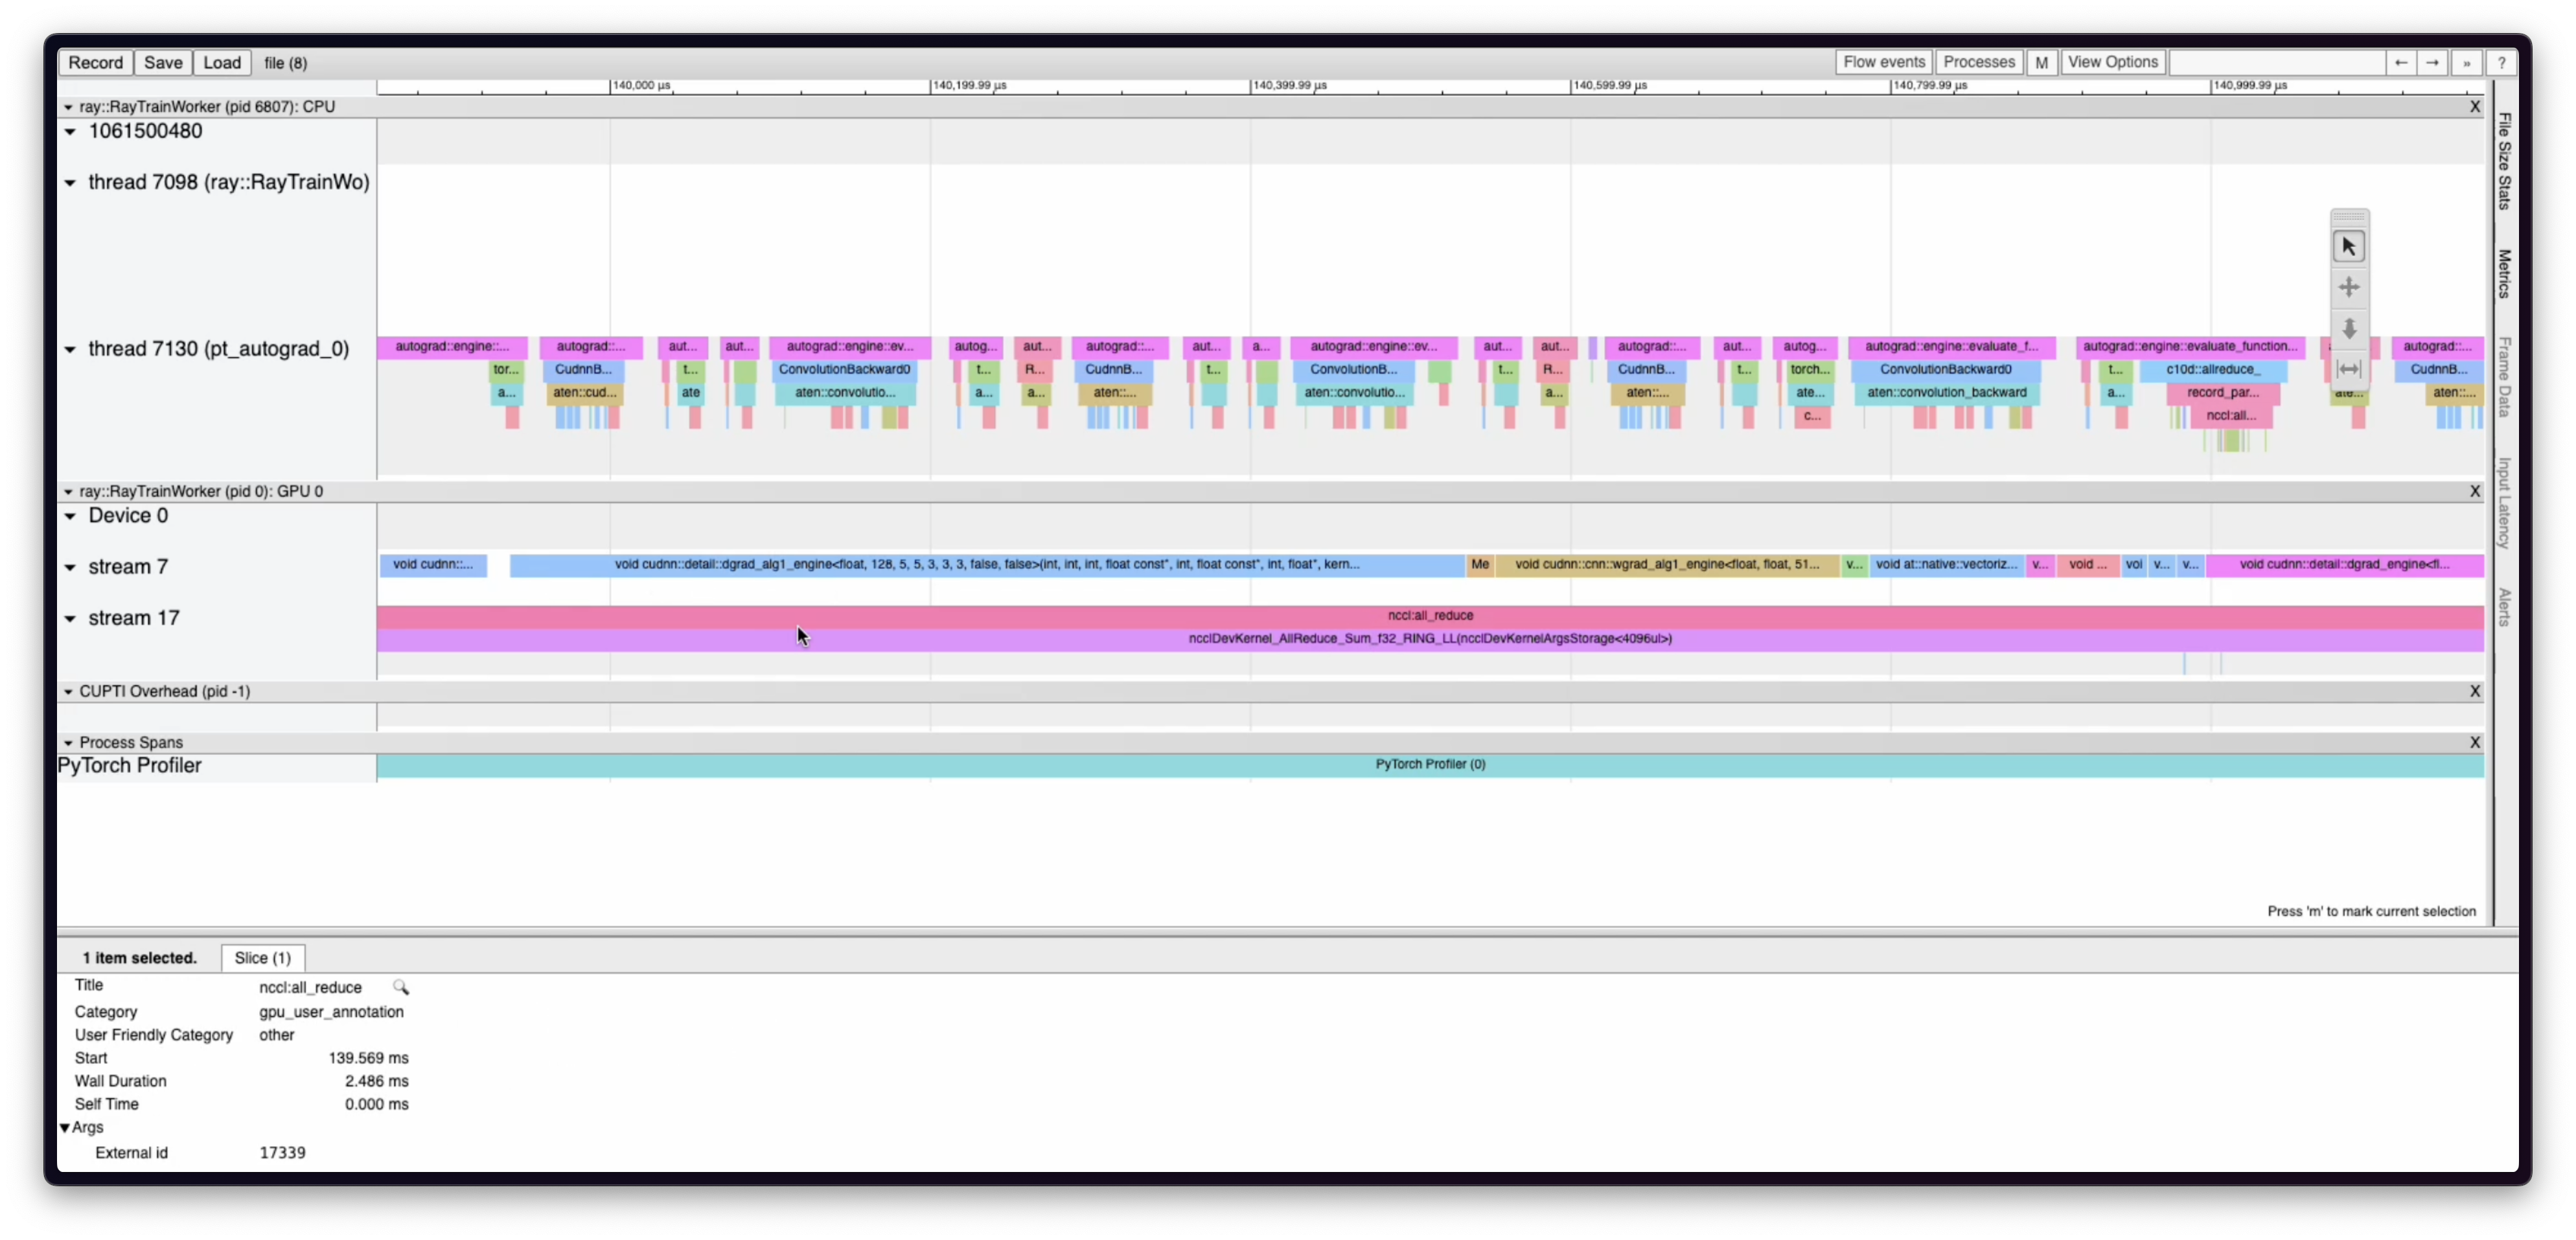
The Train dashboard allows you to take an on-demand GPU profile of a PyTorch training run to generate a trace that shows a timeline of CPU and GPU operations. Use this trace to diagnose training bottlenecks and gain a better understanding of the computation and communication operations that are happening under the hood.
The following is an example of a trace visualization generated from on-demand GPU profiling on Anyscale. This trace can help identify bottlenecks on both the CPU and GPU sides by showing a timeline of CPU operations and GPU kernels. The example trace shows a collective all-reduce operation which is part of the Distributed Data Parallel algorithm for distributed training.
Configure GPU profiling for Anyscale
This feature relies on Dynolog. Complete the following steps to set up dependencies:
- Anyscale base images include Dynolog binaries for all Ray versions 2.47.0 or later. If you're building your own image and not extending an Anyscale base image, install the Dynolog binaries on your container image. See the installation instructions on the Dynolog repo.
- Set the
KINETO_USE_DAEMONandKINETO_DAEMON_INIT_DELAY_Senvironment variables on the training workers. Here's how you can do this with Ray Train:
trainer = ray.train.torch.TorchTrainer(
    ...,
    run_config=ray.train.RunConfig(
        ...,
        worker_runtime_env={
            "env_vars": {"KINETO_USE_DAEMON": "1", "KINETO_DAEMON_INIT_DELAY_S": "5"}
        },
    )
)
Collect a GPU profile
Complete the following steps to generate a profile for your GPU training worker.
- Navigate to an active Train run page.
- Click on the
GPU Profilingbutton on one of the workers. - Enter the profiling duration in the configuration window that appears.
- Wait for profiling to finish. Anyscale downloads the profiling result as a JSON file that you can view in
chrome://tracingon a Chrome browser or Perfetto trace viewer.