LLMForge is being deprecated: The Ray Team is consolidating around open source fine-tuning solutions. Llama Factory and Axolotl provide enhanced functionality (quantization, advanced algorithms) and native Ray support for scaling. See the migration guide for transitioning your workflows.
Logging integrations in LLMForge
LLMForge provides configurable support for logging fine-tuning run metrics with Weights & Biases and MLflow starting with llmforge >= 0.5.6
The base LLMForge image doesn't come with these logging dependencies. To make use of W&B or MLflow, you must install wandb or mlflow on your Ray cluster. You can also specify these additional requirements in your job config or in the workspace UI. Anyscale also provides the option to build your own image with these additional dependencies on top of the base LLMForge image.
Weights & Biases Integration
To get started with W&B, you can simply pip install wandb which installs wandb across your cluster. If submitting as a job, you must specify wandb as an additional requirement in your job config.
Authentication
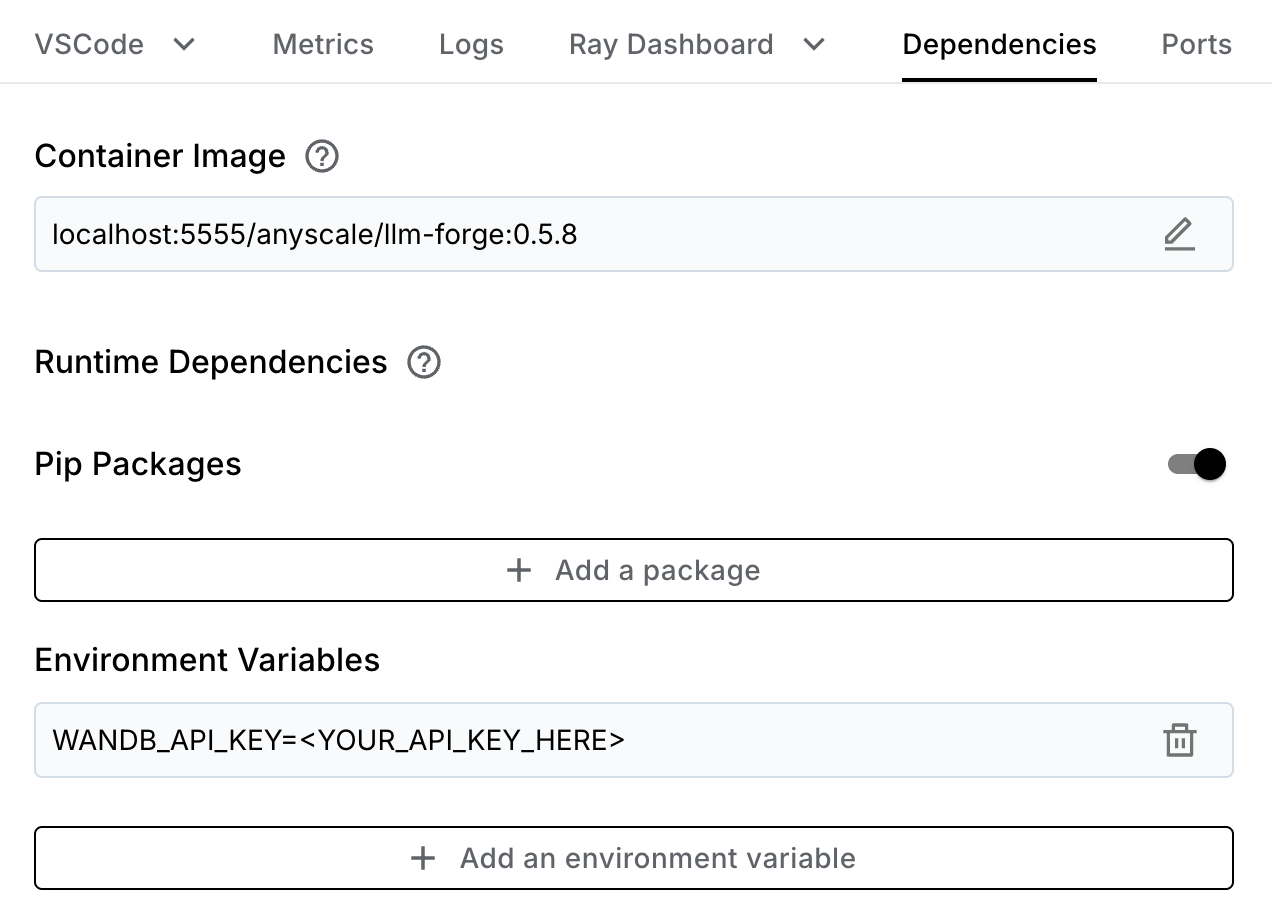
You can authenticate by setting the WANDB_API_KEY environment variable. You can use the dependencies tab if using Workspaces as shown in the example below, or by setting WANDB_API_KEY in the env_vars of the JobConfig if submitting a fine tuning run as a job. Enabling Weights and Biases without first setting the WANDB_API_KEY results in an error.

Configuring a fine-tuning run
logger:
    provider: wandb
    provider_config:
         project: llmforge # wandb project (default set to `llmforge`)
         group: my_run_group # optional wandb group (default set to model id)
         name: my_custom_run_name # optional wandb run name (default set to generated model tag)
         tags:   # optional list of tags for the run, base model and generated model_tag are included by default
               - custom_tag1
               - custom_tag2
    rank_zero_only: True # logs only on the rank 0 device if True
When starting a fine tuning run using llmforge anyscale finetune, enable W&B logging by setting the logger provider to wandb. Additionally, you can set the provider_config to specify project, group, name, and tags. By default the W&B project is llmforge, and run names are automatically generated. You can also toggle the option to log with W&B on just the rank 0 device, or on all devices by changing rank_zero_only, which is True by default. You can find full config specifications at the API reference, and documentation for W&B at the W&B docs page.
Quickstart
The minimum config change you need to start logging with W&B is to specify wandb as the provider in the logger field.
logger:
  provider: wandb
By default the base model and generated model tag are automatically set as tags for the W&B run, and the run name is also set to the unique model tag.

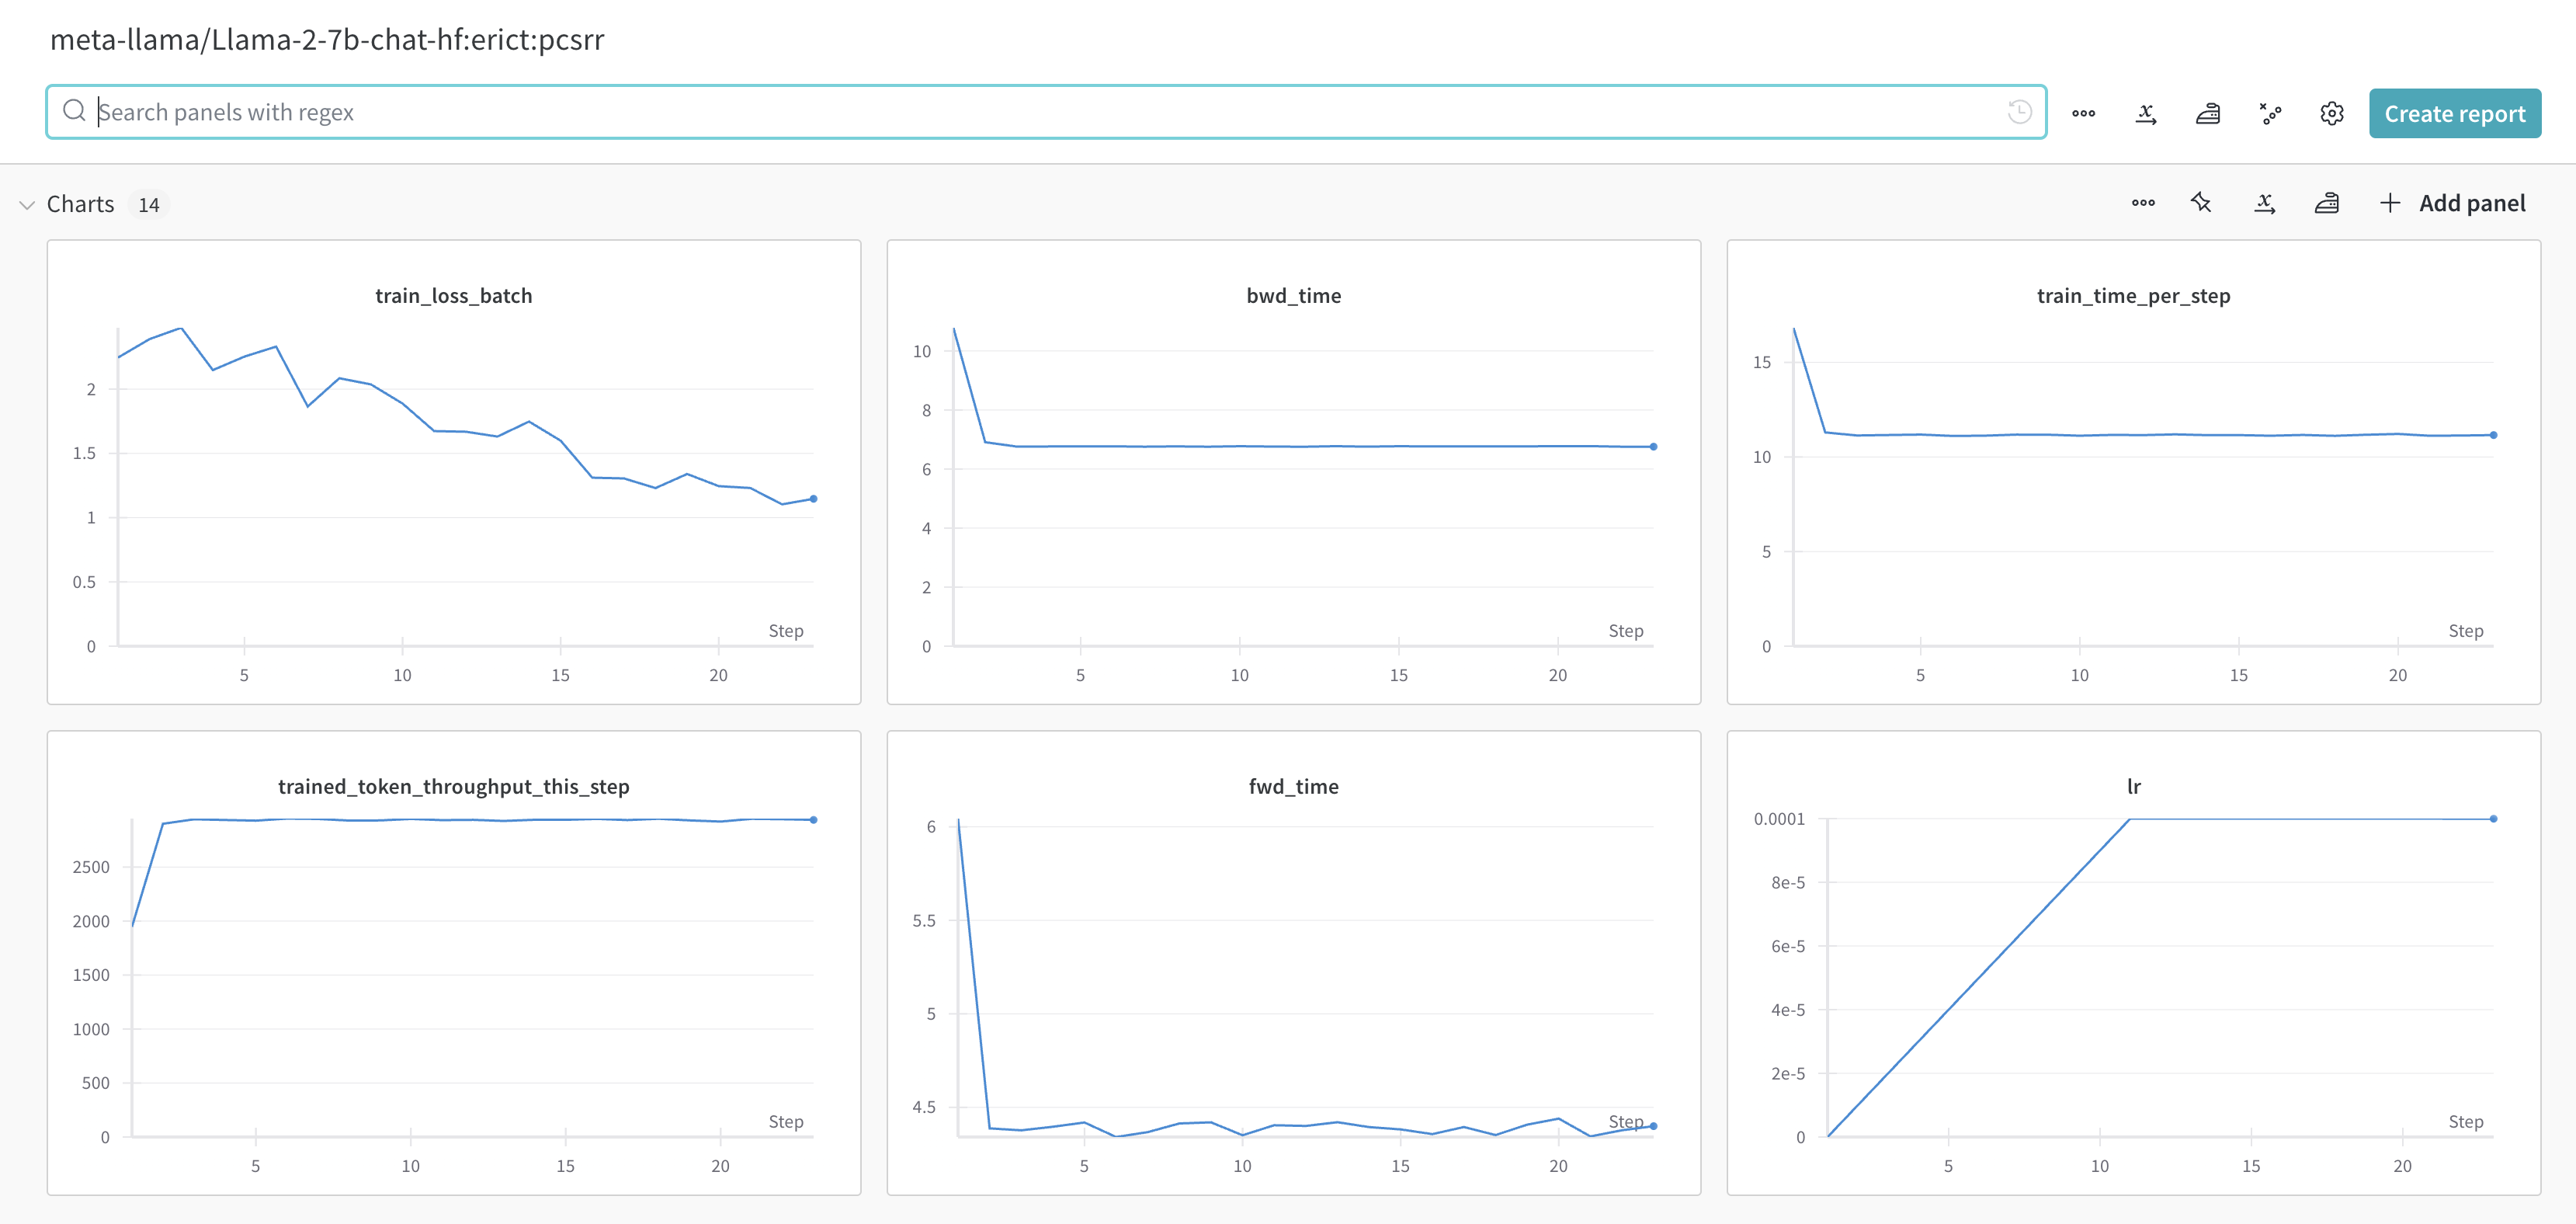
The example below shows the metrics that W&B logs by default:

MLflow Integration
To get started with MLflow, make sure to install the mlflow Python package in the same way as shown for wandb. LLMforge only supports logging metrics with MLflow, and doesn't support logging models with the MLflow model registry.
Authentication
To authenticate with MLflow, set the MLFLOW_TRACKING_TOKEN environment variable using the same instructions as for setting the WANDB_API_KEY.
Configuring a fine-tuning run
logger:
  provider: mlflow
  provider_config:
    tracking_uri: https://***.cloud.databricks.com/  # valid tracking uri (must be set)
    experiment_name: /Users/***/llmforge  # path to where experiments are logged (must be set)
    run_name: my_custom_run_name  # optional mlflow run name (default set to generated model tag)
    tags: # optional dictionary of tags for the run (key and value must be strings), base model and generated model_tag are set by default
      custom_tag1: custom_value1
      custom_tag2: custom_value2
    create_experiment_if_not_exists: True  # whether to create a new experiment if the provided experiment name does not exist
  rank_zero_only: True  # logs only on the rank 0 device if True
Enable MLflow logging by setting the logger provider to mlflow, and setting the provider_config to specify tracking_uri.
Users can choose to specify an existing experiment, which is the equivalent of a W&B project, by providing an existing experiment_id or experiment_name. Alternatively, users can also choose to create a new experiment by setting create_experiment_if_not_exists to True, and specifying a new experiment_name. You can find details on the logic used to set the experiment correctly at the MLflow API Reference, and find general details on tracking metrics with MLflow at the MLflow documentation page.
Quickstart
For MLflow, unlike for W&B, you must always specify the provider_config, and include a valid tracking_uri and an existing experiment_id or an experiment_name with a path that's writable by the authenticated user. The example below shows a minimum config to setup MLflow tracking.
logger:
  provider: mlflow
  provider_config:
    tracking_uri: https://***.cloud.databricks.com/
    experiment_name: /Users/***/llmforge
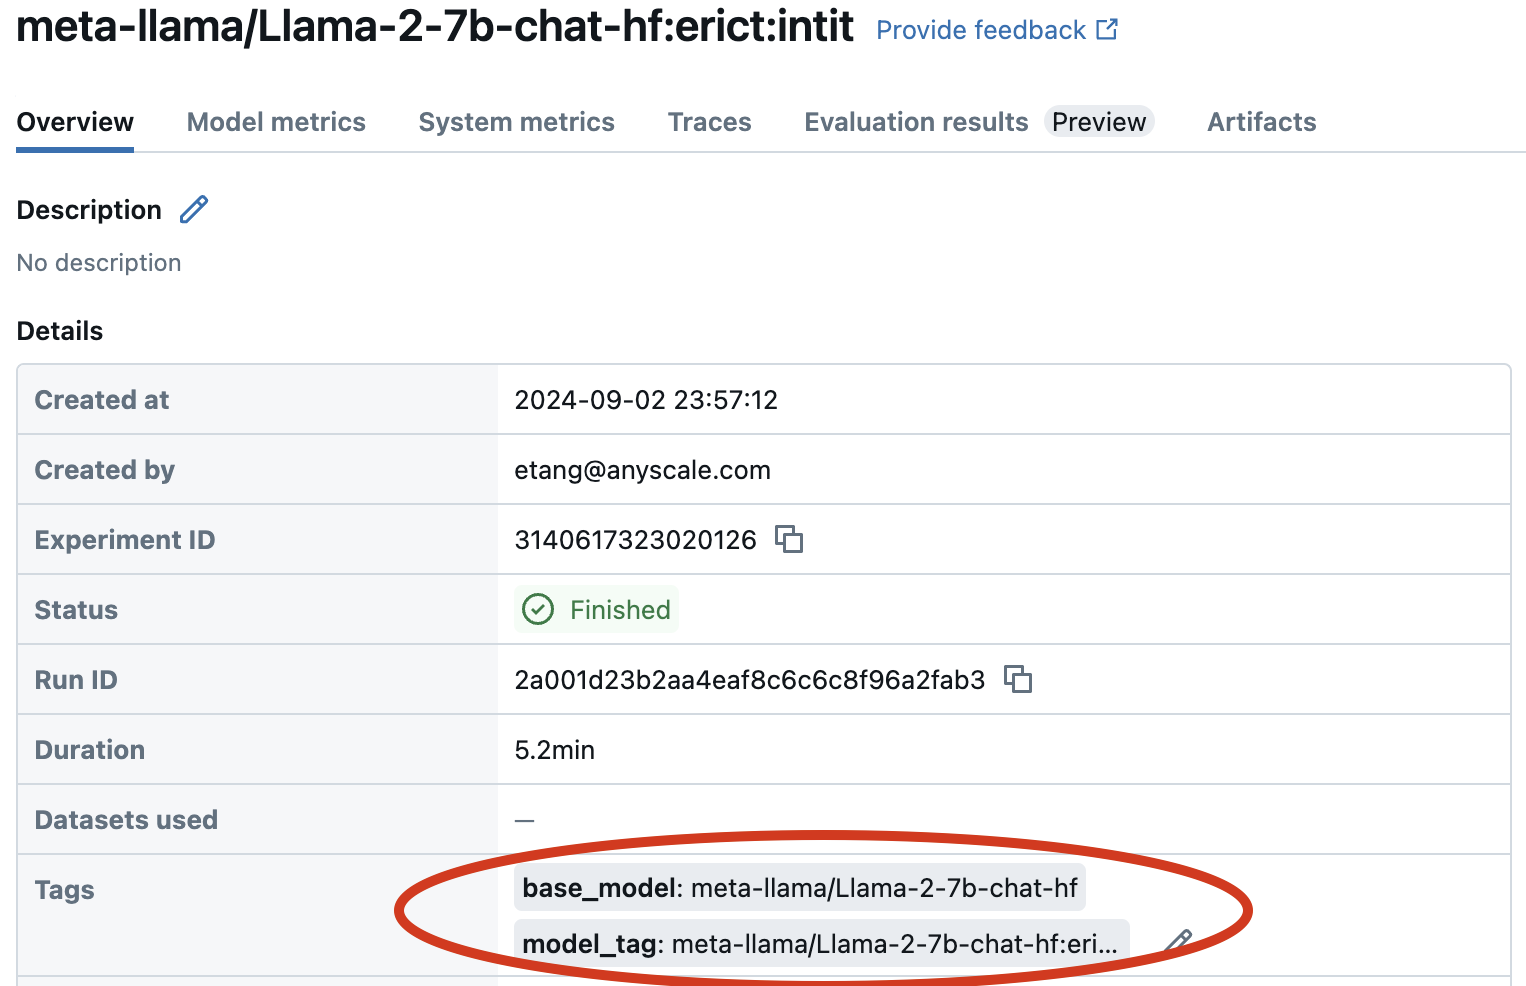
By default, LLMForge sets two tags in MLflow: the base model, with key base_model, and the generated model tag, with key model_tag. These tags allow for grouping within MLflow, as highlighted in red in the image below. Additionally, the run name is by default set to the unique model tag.

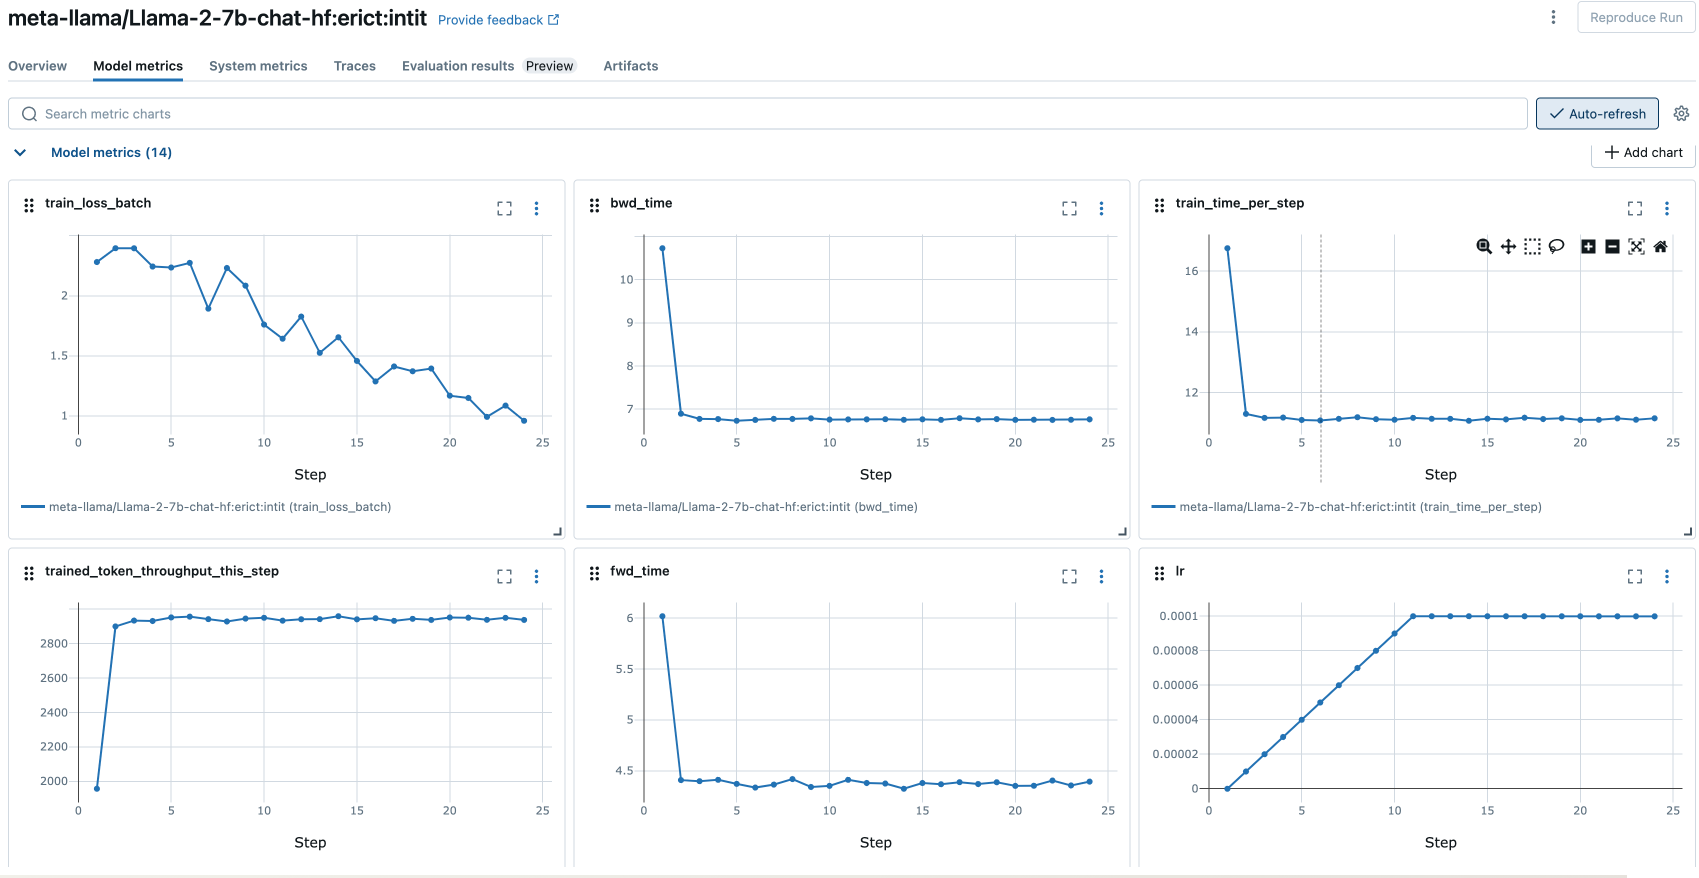
The example below shows the metrics logged to MLflow:

Try it with templates
Example configs with the minimum changes for logging with both W&B and MLflow are in the fine-tuning template, which provides an example of how to fine tune Llama-3-8B with LoRA on 4 A10Gs. To try fine-tuning with logging on W&B in the template, run the following:
llmforge anyscale finetune training_configs/custom/meta-llama/Meta-Llama-3-8B/lora/4xA10-512-wandb.yaml
Similarly, you can get started with MLflow by specifying a valid tracking_uri and experiment_name in training_configs/custom/meta-llama/Meta-Llama-3-8B/lora/4xA10-512-mlflow.yaml, and running the following:
llmforge anyscale finetune training_configs/custom/meta-llama/Meta-Llama-3-8B/lora/4xA10-512-mlflow.yaml